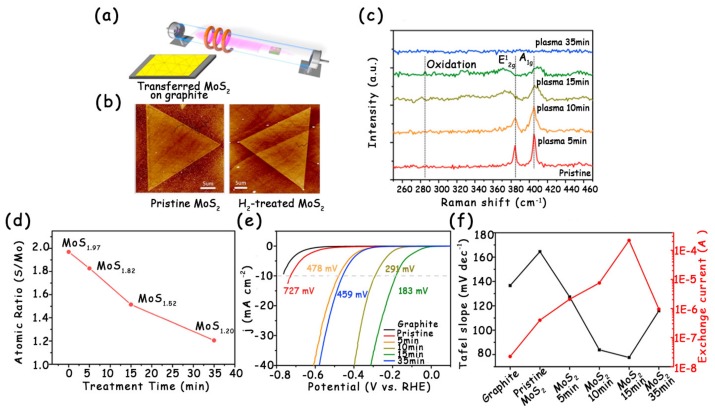
Figure 4.
(a) Schematic illustration of the experimental setup for the surface treatment of MoS2 monolayers by inductively coupled H2-plasma. (b) AFM height images of a single crystalline MoS2 monolayer flake before and after hydrogen plasma treatment. (c) Raman spectra of the MoS2/graphite before and after H2-plasma treatment for varied time periods. (d) The atomic ratio of S/Mo for the monolayer MoS2 before and after plasma treatment. (e) The polarization curves of MoS2 with various hydrogen-plasma treatment periods at the scan rate 5 mV s−1 in 0.5 M H2SO4 solutions. (f) The corresponding Tafel slopes and exchange currents extracted from (e). Reproduced with permission from Ref. 14. Copyright © 2016, Elsevier Inc.

