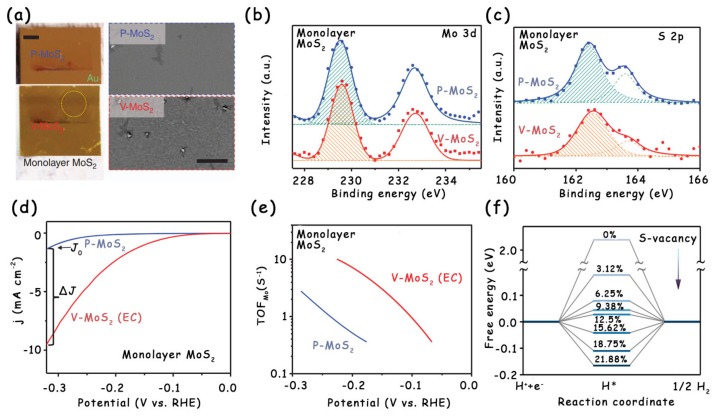
Figure 5.
(a) Optical (left side; scale bar: 2 mm) and scanning electron microscopy (SEM) images (right side; scale bar: 20 mm) of monolayer MoS2 film before (P–MoS2, upper panel) and after (V–MoS2, lower panel) desulfurization. (b) X-ray photoelectron spectroscopy (XPS) Mo 3d and (c) S 2p spectra of P–MoS2 and V–MoS2. (d) LSV curves of monolayer MoS2 before and after desulfurization. (e) Turnover frequency (TOF) per surface Mo atom (TOFMo) as a function of applied potential for P–MoS2 and V–MoS2. (f) Free energy diagram for the HER on S-vacancy sites with different vacancy concentrations. Reproduced with permission from Ref. 17. Copyright © 2017, Nature Publishing Group.

