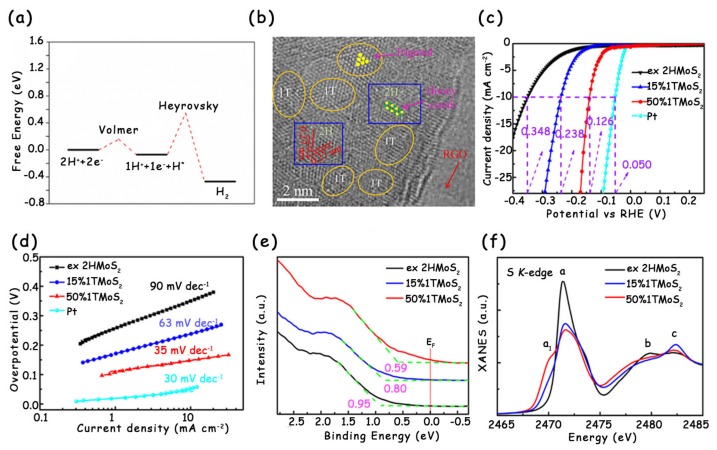
Figure 9.
(a) Free energy diagram for the Volmer–Heyrovsky route on 1T-MoS2 at the electrode potential of –0.22 V vs. NHE (~25% surface H coverage). (b) HRTEM image of the 1T-2H MoS2 with a 1T content of 50%. (c) LSV curves and (d) corresponding Tafel slopes of ex-2H MoS2, 15% 1T MoS2, 50% 1T MoS2, and Pt. (e) Ultraviolet photoelectron spectra (UPS) and (f) S K-edge X-ray absorption near-edge structure (XANES) spectra of ex-2H MoS2, 15% 1T MoS2, and 50% 1T MoS2 nanosheets. (a) has been reproduced with permission from Ref. 46. Copyright © 2016, American Chemical Society. (b–f) have been reproduced with permission from Ref. 50. Copyright © 2017, American Chemical Society.

