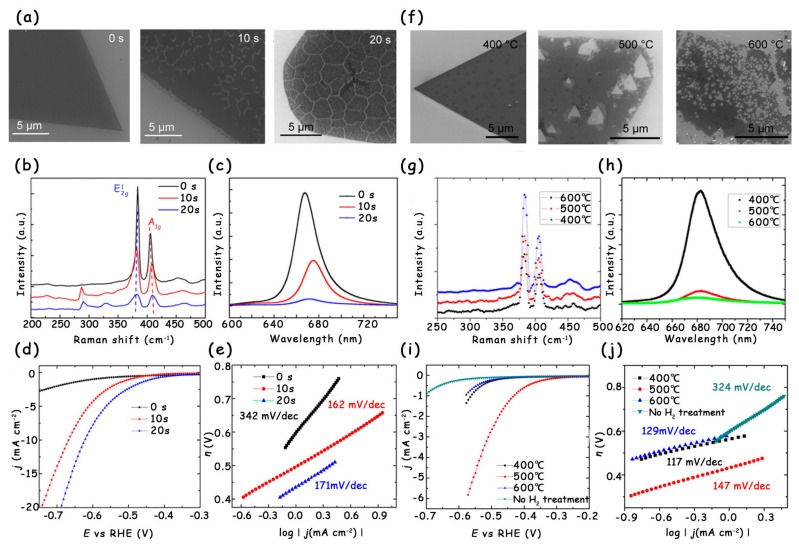
Figure 11.
(a) SEM images, (b) Raman spectra, and (c) PL spectra of monolayer MoS2 with 0, 10, and 20 s oxygen plasma exposure. (d) LSV curves and (e) corresponding Tafel slopes of monolayer MoS2 with 0, 10, and 20 s oxygen plasma exposure. (f) SEM images, (g) Raman, and (h) PL spectra of monolayer MoS2 after H2 annealing at 400, 500, and 600 °C. (i) LSV curves of monolayer MoS2 with no H2 treatment and H2 annealing at 400, 500, and 600 °C. (j) The corresponding Tafel slopes derived from (i). Reproduced with permission from Ref. 16. Copyright © 2016, American Chemical Society.

