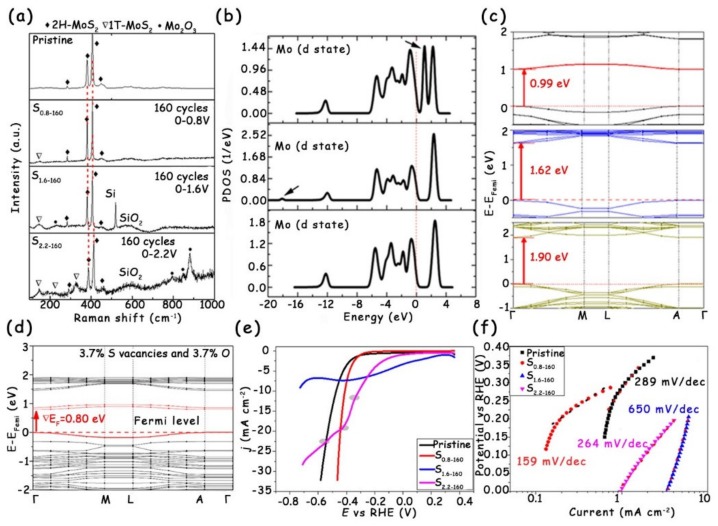
Figure 12.
(a) Raman spectra of the multilayer 2H-MoS2 nanosheets treated under a varied scanning potential range. (b) Partial density of states (PDOS) of Mo-d and (c) calculated band structures for (3 × 3 × 1) 2H-MoS2 containing 3.7% S vacancies or 3.7% O atoms, and the pristine one (from top to bottom). (d) Band structures of (3 × 3 × 1) 2H-MoS2 with 3.7% O atoms and 3.7% S vacancies. (e) Polarization curves and (f) corresponding Tafel plots of the MoS2 nanosheets after electrochemical treatments with CVs at different scan potential ranges. Reproduced with permission from Ref. 59. Copyright © 2018, American Chemical Society.

