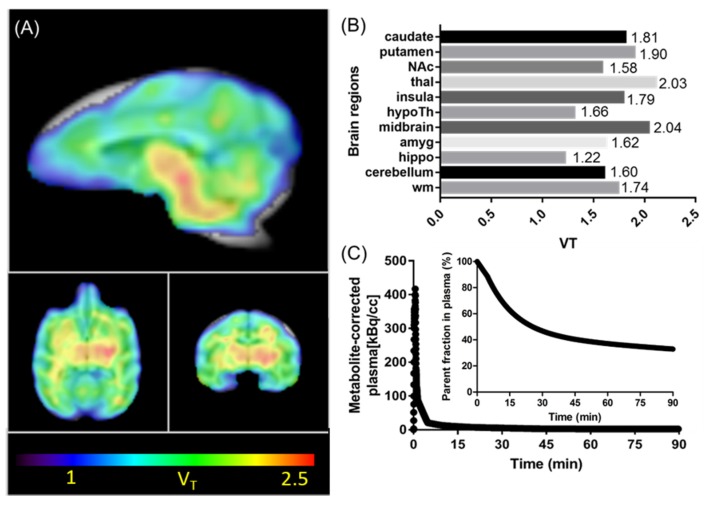
Figure 5.
Kinetic modeling results with [11C]CW24 in the macaque brain. (A) The total volume of distribution (VT) images derived from Logan plot with arterial blood data as input function (color bar indicates VT values from 1–2.5 mL/cm3 (blue to red); (B) Regional VT values showed that the expression difference in brain regions; (C) Arterial plasma analysis showed that [11C]CW24 radioactivity was rapidly cleared from blood and [11C]CW24 stability evaluated in plasma over time showed lasting presence of ~47% of parent compound at 30 min.

