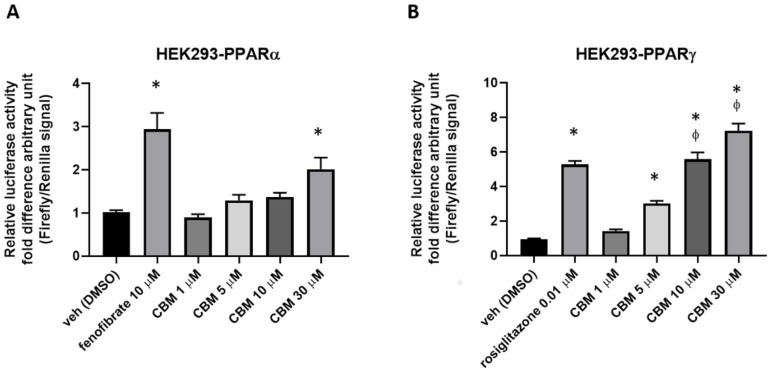
Figure 6.
Luciferase assays performed in PPARα- (A) or PPARγ-transfected (B) HEK293 cells. Bar graphs showing the ratio between firefly and Renilla luciferase in response to crescent concentrations of cannabimovone (CBM; up to 30 μM). Fenofibrate and rosiglitazone were used as positive controls for PPARα and PPARγ, respectively. The vehicle group was set to 1; thus, the relative luciferase activities obtained for each tested compound and concentration are presented as a fold induction with respect to the vehicle control. Each point is the mean ± SEM of four separate determinations performed in duplicate. Statistically significant differences were accepted when the p-value was at least ≤0.05. The asterisk (*) denotes a p-value ≤ 0.05 vs. vehicle group; the symbol ϕ denotes p ≤ 0.05 vs. vehicle group vs. CBM 5 µM.

