Figure 5.
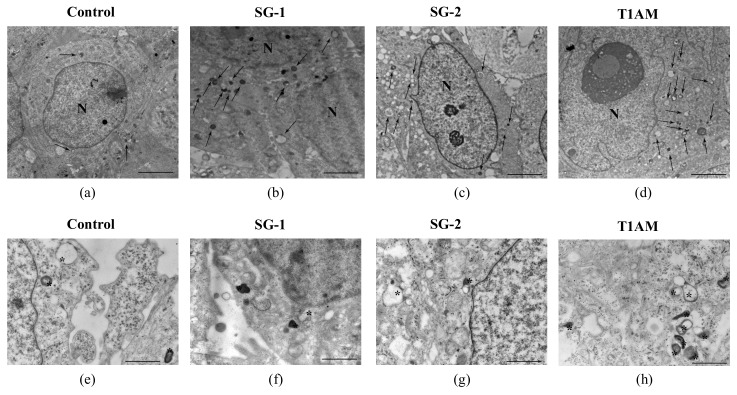
Transmission electron microscopy of U87MG cells. Representative pictures of -autophagy like vacuoles (arrows) in the cytoplasm in baseline conditions (a) and after treatment with 1 μM SG-1, SG-2 or T1AM at 24h, (b–d). High magnification of different shaped autophagy like vacuoles (asterisk) in baseline conditions (e) and after treatment with 1 μM SG-1, SG-2 or T1AM at 24h (f–h). The mean number of autophagy -like vacuoles per cell was counted and values were reported in graph for each compound (i–k). The graphs show that all compounds induce a time-dependent increase in the number of autophagy -like vacuoles compared with baseline conditions. Values represent the mean ± SEM of 30 cells for each group (n = 30). Comparisons between groups were made by using one-way ANOVA followed by a Dunnett’s post-test. ** p ≤ 0.05 compared with baseline conditions. Scale bars (a–d) = 1µm; (e–g) = 160 nm.


