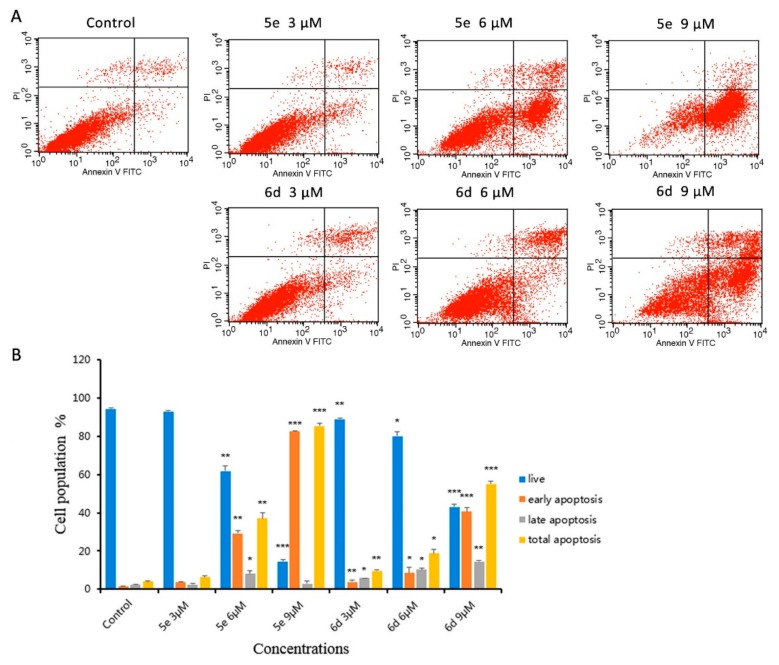
Figure 4.
Apoptosis in HepG2 cells by treatment with 5e and 6d: (A) HepG2 cells were incubated with different concentrations of 5e and 6d for 24 h and the cells were stained with annexin V-FITC and PI, followed by flow cytometry analysis. (B) Quantitative population analysis of annexin V-FITC/PI staining, presented as mean ± SD of three individual experiments, * p < 0.05, ** p < 0.01, *** p < 0.001 vs control group.

