Figure 1.
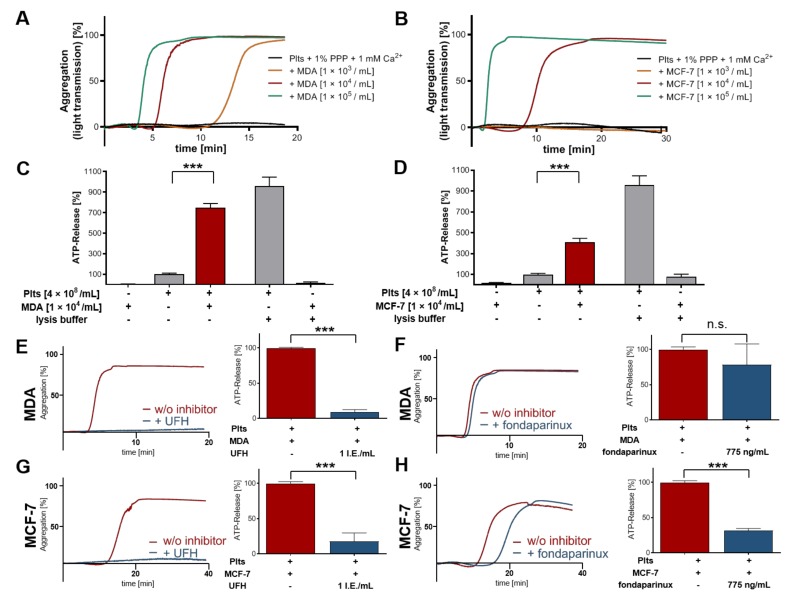
Tumor cell-induced platelet secretion and aggregation. (A,B) Representative traces showing platelet-tumor cell aggregation in response to increasing concentrations of (A) MDA-MB-231 cells for 20 min (n = 5) or (B) MCF-7 cells for 30 min; (C) quantification of ATP release from resting platelets, 1 × 10⁴ MDA-MB-231 cells/mL, platelets co-incubated with 1 × 10⁴ MDA-MB-231 cells/mL for 30 min, platelets treated with 1% Triton X-100, or MDA-MB-231 cells (1 × 10⁴ cells/mL) treated with 1% Triton X-100, respectively; (D) quantification of ATP release from resting platelets, MCF-7 cells, platelets co-incubated with MCF-7 cells for 30 min, platelets treated with 1% Triton X-100, or MCF-7 cells (1 × 10⁴ cells/mL) treated with 1% Triton X-100, respectively; (E) representative traces showing platelet aggregation in response to MDA-MB-231 cells (1 × 10⁴/mL) or MCF-7 cells (1 × 10⁴/mL) (n = 5). Platelets were preincubated with 1 IU/mL UFH (left part of the figure) (n = 5). Quantification of ATP release from MDA-MB-231 (1 × 10⁴/mL) cell or MCF-7 (1 × 10⁴/mL) cells stimulated platelets preincubated with 1 IU/mL UFH (n = 5) (right part of the figure); (F) representative traces showing platelet aggregation in response to MDA-MB-231 cells (1 × 10⁴/mL) or MCF-7 cells (1 × 10⁴/mL) (n = 5). Platelets were preincubated with 775 ng/mL fondaparinux (left part of the figure) (n = 5). Quantification of ATP release from MDA-MB-231 (1 × 10⁴/mL) cell or MCF-7 cells (1 × 10⁴/mL) stimulated platelets preincubated with 775 ng/mL fondaparinux (n = 5) (right part of the figure). *** p < 0.001 indicated statistical significance.

