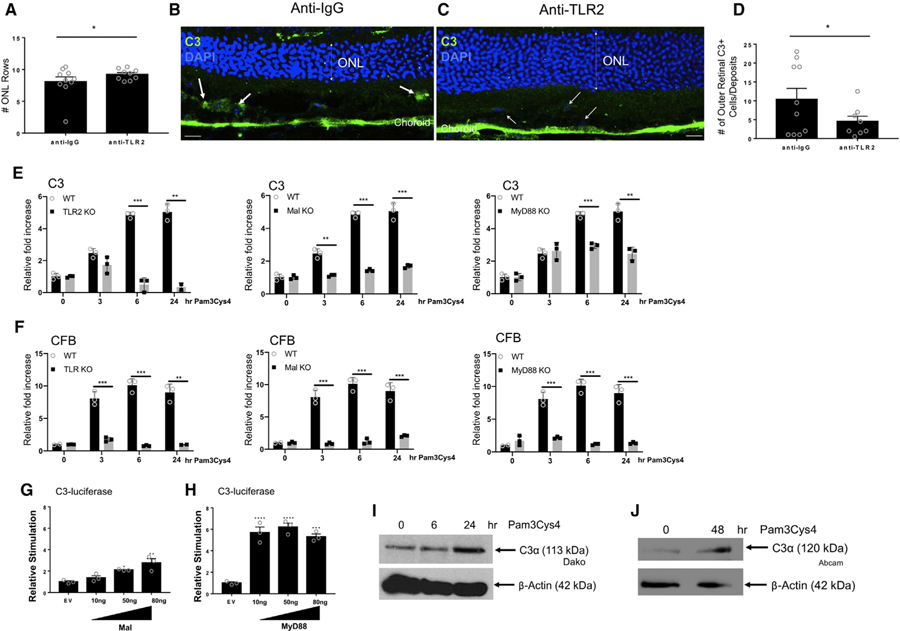
Figure 2. Neutralization of TLR2 in a Photo-Oxidative Model of Retinal Degeneration and in Mononuclear Cells Decreases C3 Expression and Deposition.
(A–D) Three micrograms of anti-TLR2 or anti-IgG was injected IVT into C57Bl6 mice that were then exposed to 100K lux light for 7 days.
(A) Quantification of photoreceptor cell rows in anti-IgG versus anti-TLR2 groups.
(B and C) Immunofluorescence (IF) of C3 (green) and nuclear DAPI (blue) in mice injected with (B) anti-IgG versus (C) anti-TLR2 (scale bars represent 20 µm).
(D) Quantification of outer retinal C3 positive cells/deposits detected in ONL and subretinal space. Data shown are mean ± SEM. The p value was determined by nonparametric t test, p < 0.05. n = 9–10 per experiment, *p < 0.05.
(E and F) BMDMs from WT, TLR2–/–, Mal–/–, or MyD88–/–mice were treated for 3, 6, and 24 h with 20 nM of Pam3Cys4; expression of (E) C3 and (F) CFB was assayed by RT-PCR.
(G and H) HEK293-TLR2 cells were transfected for 24 h with C3 promoter-luciferase (100 ng), Renilla-luciferase (40 ng), and empty vector (EV) or plasmid expressing (G) Mal or (H) MyD88 at 10, 50, and 80 ng. Results are normalized for Renilla luciferase activity and represented as relative stimulation over the non-stimulated EV control, mean ± SD for triplicate determinations p value determined by one-way ANOVA and Tukey post test: *p < 0.05, **p < 0.01, ***p < 0.001.
(I and J) Secreted C3 expression in (I) BMDMs and (J) primary mouse microglia treated with 20 nM of Pam3Cys4 for 6 and 24 or 48 h.

