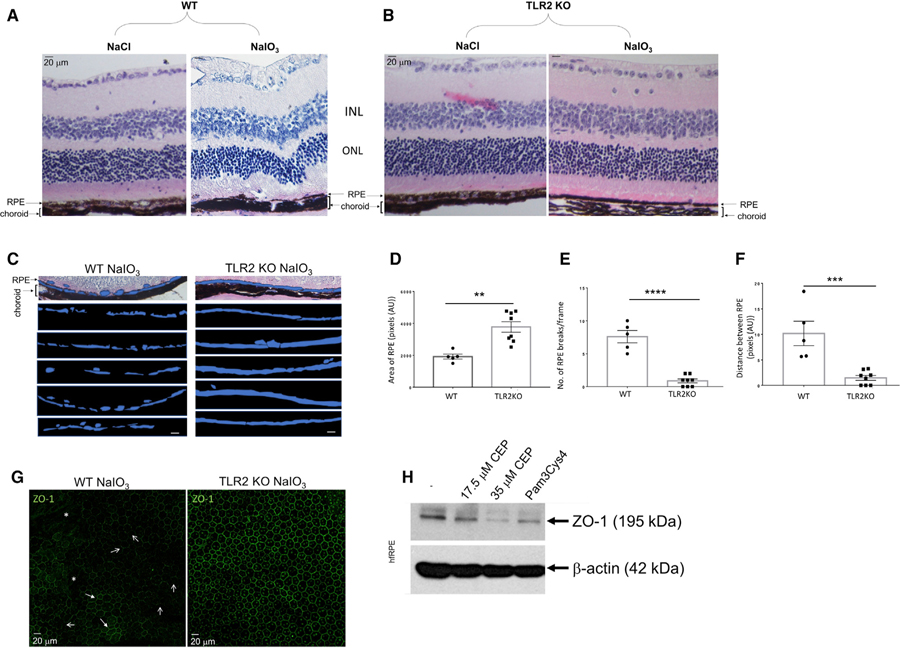
Figure 3. TLR2–/– Mice Are Protected from Oxidative Stress-Induced RPE Damage.
(A–F) Histological H&E analysis of (A) WT and (B) TLR2–/– mice injected intravenously (i.v.), via tail vein, with NaCl or NaIO3 (50 mg/kg).
(C and D) Quantification of RPE area (in blue)/pixel (scale bars represent 20 µm) in (C) WT and (D) TLR2–/– mice. *p < 0.05, **p < 0.01, ***p < 0.001.
(E) Number of RPE breaks/frame.
(F) Distance between RPE monolayer breaks measured using the software ImageJ (n > 5 mice per genotype).
(G) IF of ZO-1 on RPE flatmounts from WT mice and TLR2–/– mice 8 h post NaIO3 (n > 5 per genotype; asterisks, ZO-1 loss; closed arrows, areas cobblestone patterning; open arrows, areas of discontinuous membrane staining).
(H) ZO-1 western blot in hfRPE cells treated with 17.5 µM or 35 µM of CEP-HSA and 20 nM of Pam3Cys4, 24 h. See also Figures S3–S5.

