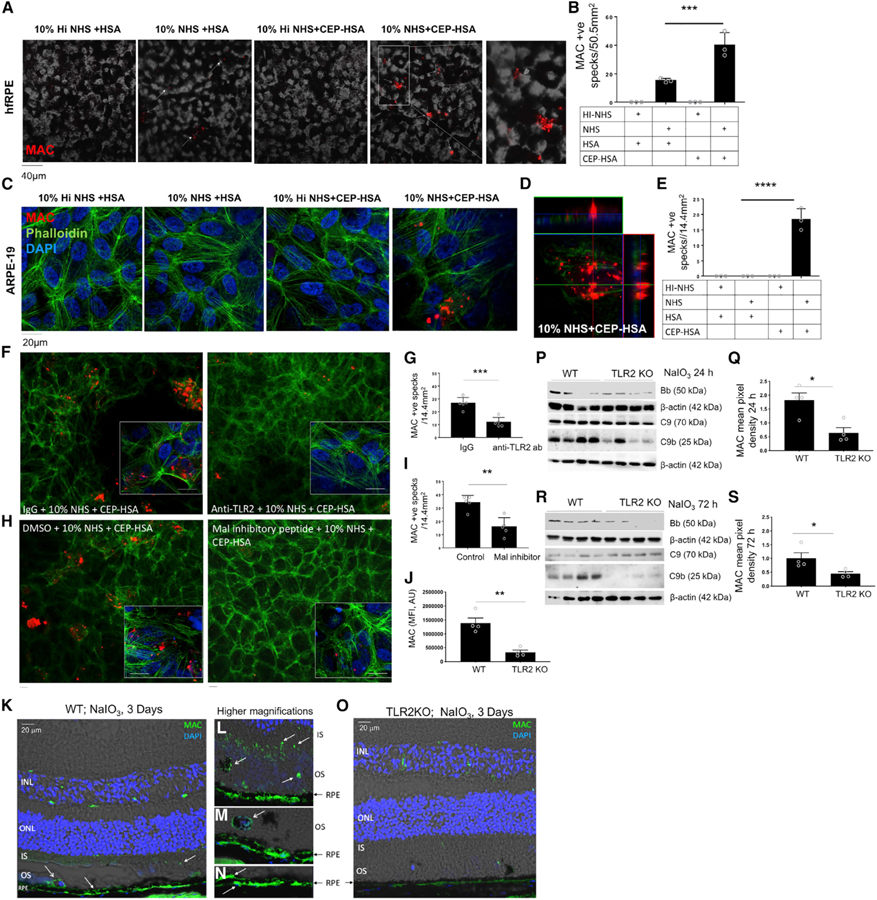
Figure 5. Oxidative Stress Products Drive AP Activation and MAC Formation in a TLR2-Dependent Manner.
(A–E) Polarized hfRPE cells (A and B) or ARPE-19 cells (C–E) were treated with 10% Hi-NHS or NHS in combination with HSA or CEP-HSA for 24 h, phase transmission, presence of MAC (red), Phalloidin (green), and DAPI (blue), with representative images from three separate experiments.
(B and E) Quantification of MAC+ specks in three 303 frames, data mean ± SD, one-way ANOVA followed by Tukey post-test to determine significance between groups; ***p < 0.001.
(F–I) IF of MAC (red), Phalloidin (green), and DAPI (blue) in ARPE-19 cells treated with (F and G) 0.1 µg of IgG or anti-TLR2 antibody for 1 h or (H and I) with DMSO or 40 µm of Mal peptide inhibitor for 2 h prior to CEP-HSA and 10% NHS for 24 h.
(G and I) quantification of MAC+ specks in four 20× frames, mean ± SD; p value determined by nonparametric t test; p < 0.05.
(J–O) WT and TLR2–/– mice injected IV, with NaIO3 (50 mg/kg).
(J) Quantification of MAC fluorescent intensity (scale bars represent 20 µm).
(K–O) Representative IF images of MAC at 72 h, (K and O) depicts MAC staining in the whole retina section, (L–N) show higher magnifications, (L) shows MAC in the IS and OS, (M) shows MAC in OS and on RPE, (N) shows MAC on RPE.
(P and R) Lysed tissue was assayed by western blot for expression of CFB(Bb). C9 and C9b at (P) 24 h and (R) 72 h.
(Q and S) Mean pixel density for C9b was quantified at (Q) 24 h and (S) 72 h using the software ImageJ.
See also Figures S6 and S7. *p < 0.05, **p < 0.01, ***p < 0.001.

