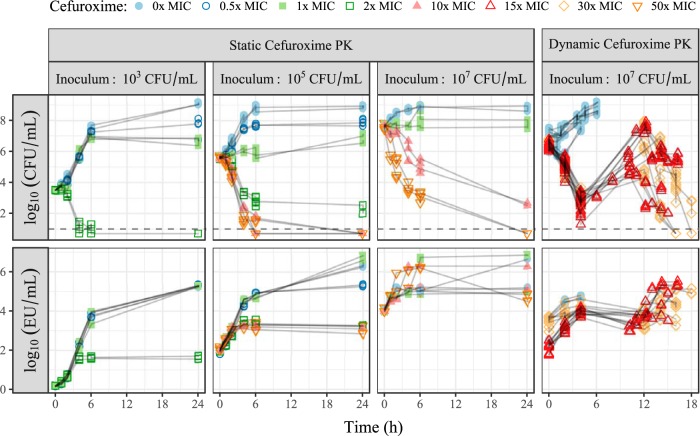
FIG 1.
Overview of available data (points) from individual experiments (connected with lines), showing the time courses of CFU (top) and endotoxin units (EU) (bottom). The studies were performed with static or dynamic cefuroxime concentrations at various starting inocula, and the color and shape of the points refer to cefuroxime exposure, as indicated in the key. The horizontal dashed lines indicate the lower limit of detection (10 CFU/ml). PK, pharmacokinetics.

