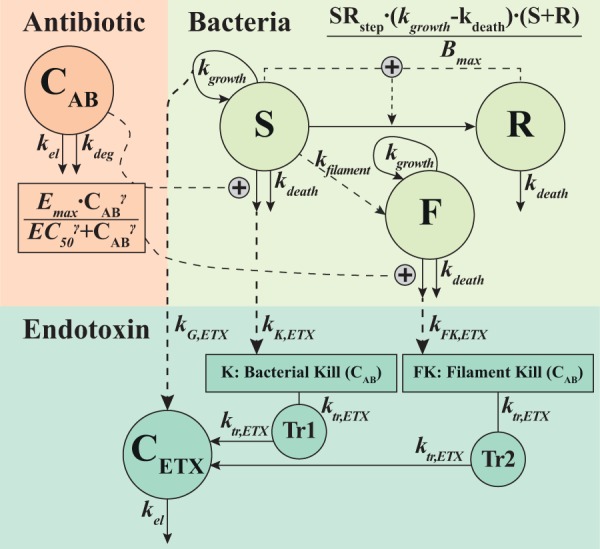
FIG 2.

Schematic of the final model, linking the antibiotic concentration-time course (CAB) to the bacterial dynamics represented by the S (susceptible), R (resting), and F (filament) states, with the antibiotic stimulating killing of the S (and F) population(s) through a sigmoidal Emax relationship to cefuroxime exposure (CAB). The increase in the LPS/endotoxin concentration (CETX) was driven by the growth of the bacteria in S (direct contribution to CETX) and by the antibiotic-induced killing of bacteria in S and F (delayed contribution to CETX through transit compartments 1 [Tr1] and 2 [Tr2]). See Table 1 for parameter estimates.
