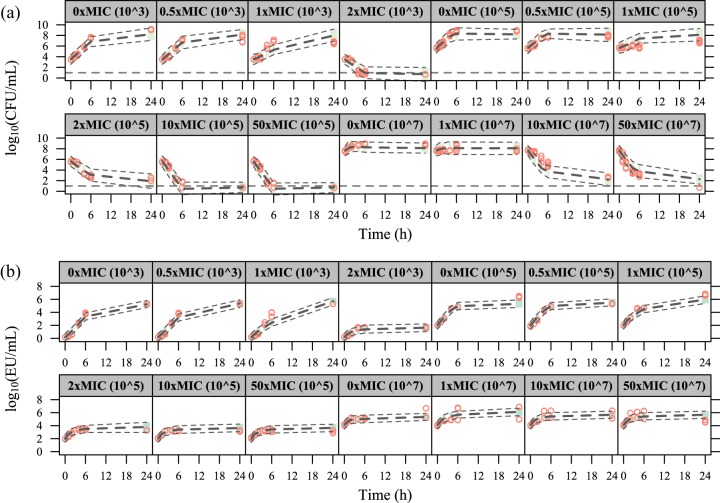
FIG 3.
Visual predictive checks for the time courses of CFU (a) and endotoxin units (EU) (b) in the experiments with static cefuroxime concentrations. The red circles correspond to the observed data, while the long-dashed lines correspond to the median simulated data. The shaded area between the two short-dashed lines corresponds to the 95% confidence interval (CI) around the simulated median data. The horizontal dashed line in panel a indicates the lower limit of detection (10 CFU/ml).

