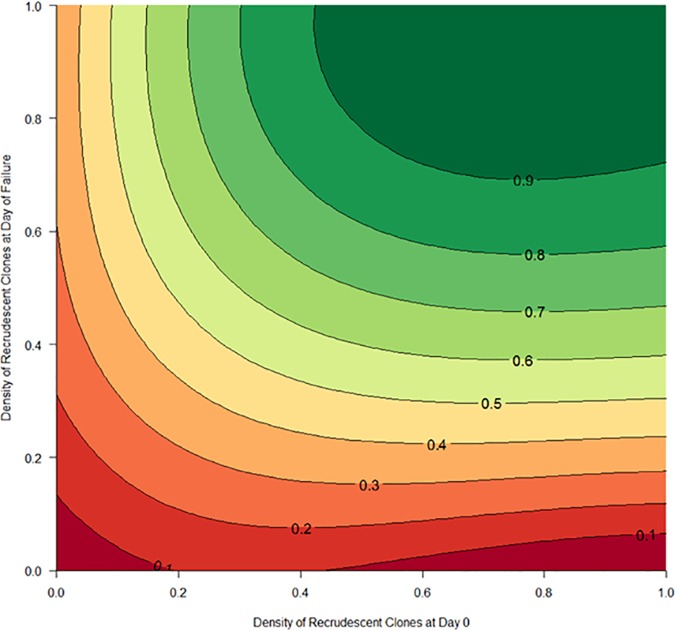
FIG 5.
Contour plot of the posterior probability of recrudescence estimated by the Bayesian algorithm as a function of the density of recrudescent clones (i.e., the proportion of recrudescent clones in the total recurrent infection biomass) in the initial sample and the recurrent sample. The plot shows the combined data from all 6 scenarios modeled for AR-LF. Each contour line indicates the posterior probability of recrudescence, and the areas between the lines represent the numbers of recurrent infections in the population with those posterior probabilities.

