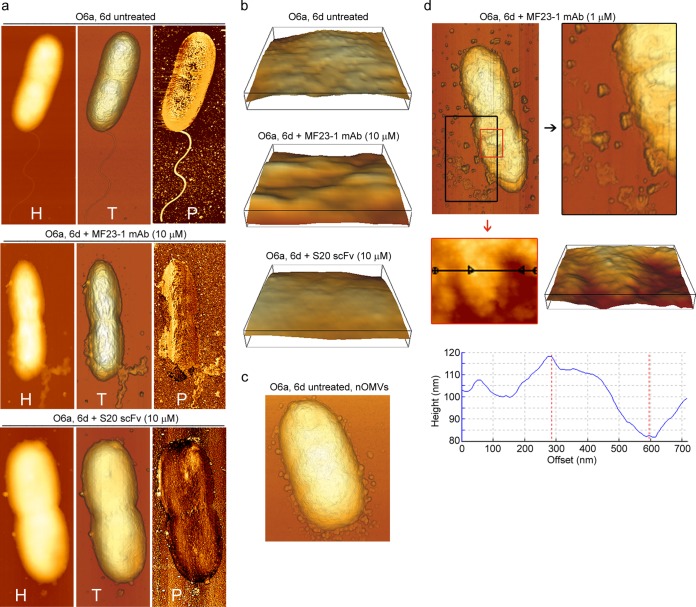
FIG 6.
AFM images showing damage to P. aeruginosa O6a, 6d cells induced by treatment with various concentrations of MF23-1 MAb and S20 scFv at 37°C for 30 min. (a) AFM height (H), topographic (T), and phase-contrast (P) images of untreated O6a, 6d cells, of O6a, 6d cells treated with 10 μM MF23-1 MAb (4× EC50), and of O6a, 6d cells treated with 10 μM S20 scFv monomer (22× EC50), as indicated. (b) Enlargement of three-dimensional surface patches (400 by 400 nm) of untreated O6a, 6d cells, of O6a, 6d cells treated with 10 μM MF23-1 MAb, and of O6a, 6d cells treated with 10 μM S20 scFv monomer, as indicated. (c) Untreated O6a, 6d cell releasing natural OMVs (nOMVs) from the OM. (d) Topographic AFM images of O6a, 6d treated with 1 μM MF23-1 MAb (0.4× EC50) highlighting the release of irregularly shaped micelles and membrane components (top). Their release led to the appearance of pits 15 to 35 nm deep in the membrane (middle and bottom). Height (middle left) and derived three-dimensional (middle right) images, which were obtained by zooming into the smaller, red-boxed area (top), illustrate an area that was particularly affected by the appearance of pits. Cross-section (bottom) of the area indicated by the black line (middle left) shows pits measuring up to 35 nm in depth.

