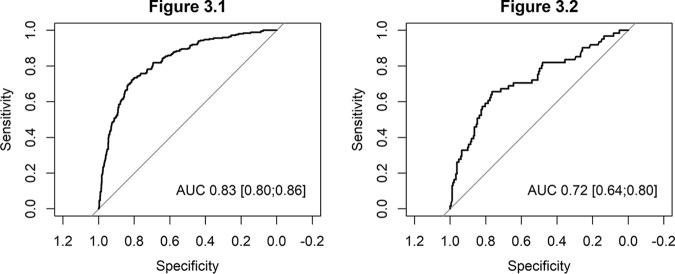
FIG 3.
(Left) Area under the curve of the predictive model of multidrug resistance in patients with Pseudomonas aeruginosa bloodstream infection in the derivation cohort. (Right) Area under the curve of the predictive model of multidrug resistance in patients with Pseudomonas aeruginosa bloodstream infection in the validation cohort.

