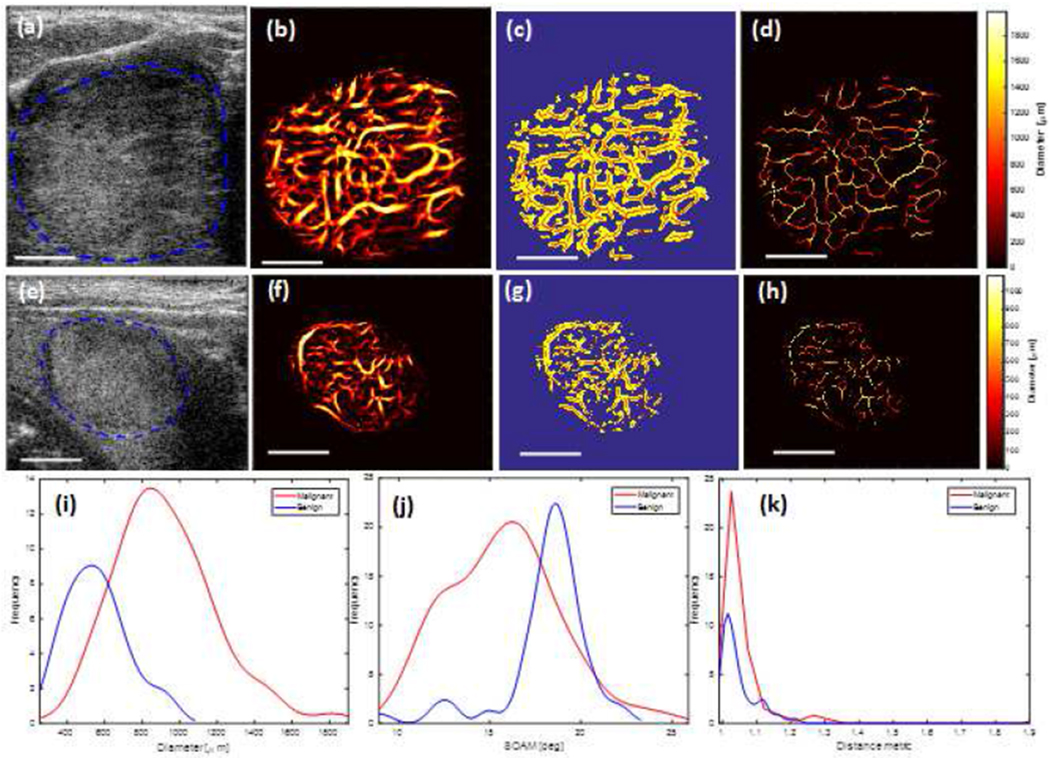
Fig. 5.

(a-d) and (e-h) show images from malignant and benign thyroid nodules, respectively. (a) and (e) Ultrasound B-mode images. (b) and (f) Microvasculature images after Hesian-based filtering. (c) and (g) Binary images (yellow) and extracted vessel segments (skeleton of image denoted by red overlay). (d) and (h) Diameter map of the vessels. (i) Histogram of the diameter. (j) Histogram of the distance metric. (k) Histogram of sumof angle metric (SOAM). The white line denotes scale of 1cm.
