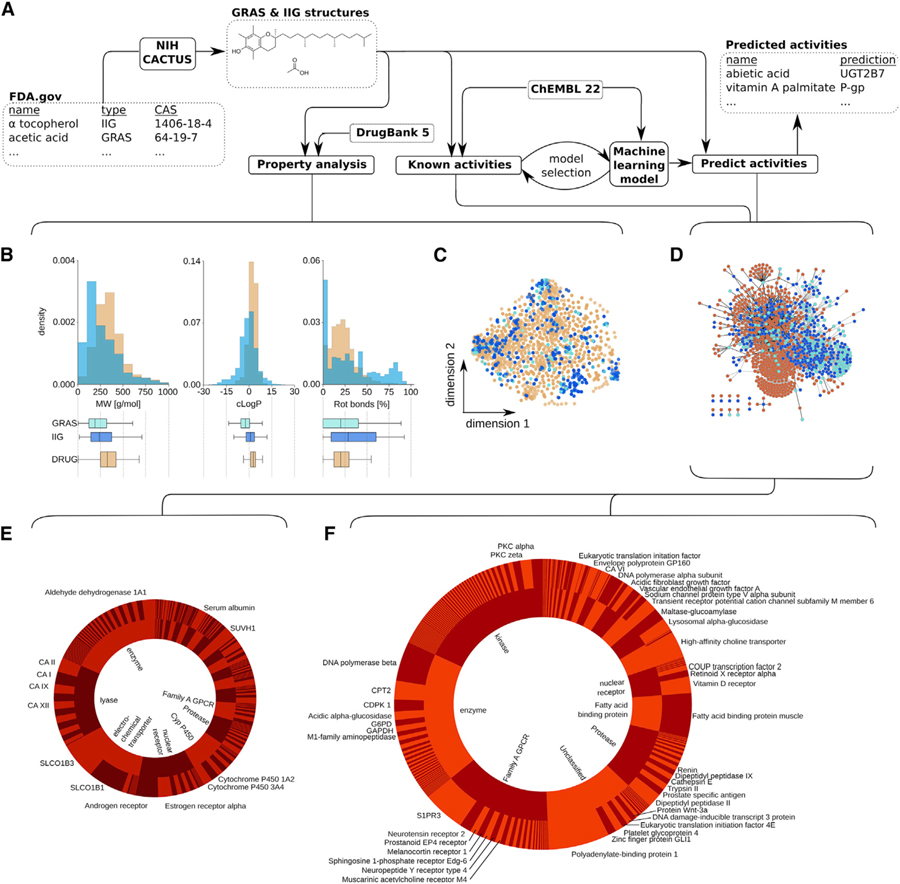
Figure 1. Inactive Ingredients and GRAS Compounds Resemble FDA-Approved Drugs and Exert Known or Potentially Novel Bioactivities.
(A) Schematic visualizing the general workflow of the study and the utilized datasets. Briefly, CAS numbers for generally recognized as safe (GRAS) and inactive ingredient (IIG) compounds were extracted and curated from the FDA website (https://www.fda.gov) and translated into SMILES structural representations using the CACTUS NIH webserver (https://cactus.nci.nih.gov). These chemical representations were then harnessed to calculate physicochemical properties (http://rdkit.org) and compare the property distributions with approved drugs (https://www.drugbank.ca). Biological activity data were extracted from ChEMBL22 (http://ebi.ac.uk/chembl) to identify previously reported activities for GRAS/IIG compounds and build machine learning models (https://scikit-learn.org) to predict additional biological activities of GRAS/IIG compounds.
(B) Distribution of molecular weight (MW), calculated logP, and the fraction of rotational bonds (rot bonds) among GRAS (light blue) and IIG (dark blue) compared to FDA-approved drugs in the DrugBank database (DRUGS, orange). Summary statistics represented through boxplots show considerable overlap in the three distinct distributions.
(C) Visualization of chemical space spanned by GRAS (light blue) and IIG (dark blue) compared to approved drugs stored within the DrugBank 5.0 database (orange). Projection based on t-Distributed Stochastic Neighbor Embedding (t-SNE) using Morgan fingerprints (r = 4, 2,048 bits; RDKit) is shown.
(D) Pharmacology network of GRAS and IIG. Compounds are shown as light blue (GRAS) or dark blue (IIG) nodes; protein targets (ChEMBL22) are shown in red.A compound and a target are connected either when the compound has been previously measured to interact with the protein (black edge) or when machine learning models predicted that the compound is likely to interact with the protein (Z score > 4; gray edge).
(E and F) Distribution of number of previously reported (left, E) and computationally predicted (right, F) activities on the level of different protein families (inner pie charts). Top seven families are labeled. Outer pie charts visualize the number of reported or predicted activities per protein. Proteins for which more than 10 GRAS or IIG compounds have been reported or predicted to modulate their activity have been annotated.

