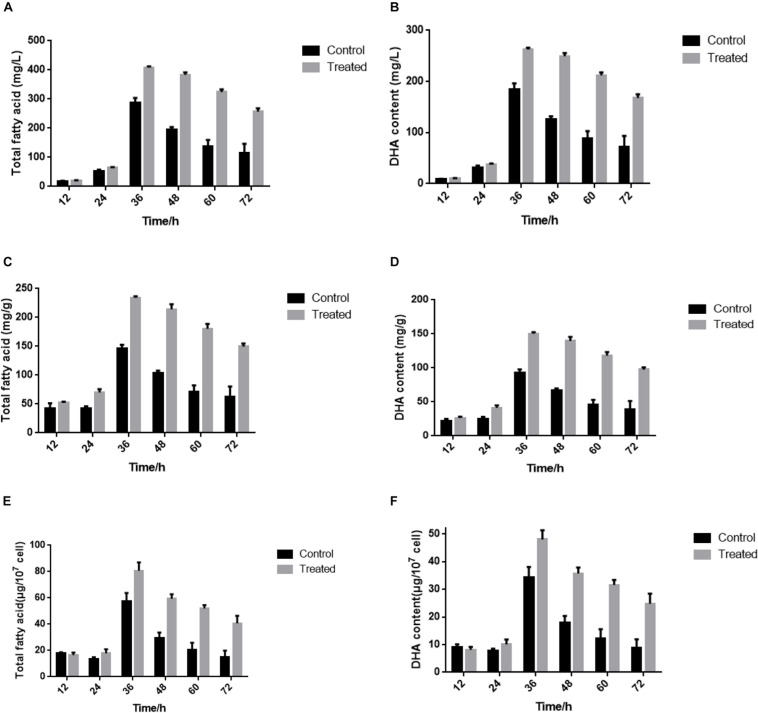
FIGURE 1.
(A,B) Content of total fatty acid and DHA in fresh weight at different cultivation times. (C,D) Content of total fatty acid and DHA in dry weight at different cultivation times. (E,F) Content of total fatty acid and DHA in 107 cell density at different cultivation times. The control groups represent that S. limacinum SR21 was cultured in basal fermentation medium with 1.0 g/L yeast extract. The treated groups represent that S. limacinum SR21 was cultured in basal fermentation medium with 0.5 g/L yeast extract. All experiments were performed in triplicate. Each value presents the mean ± SD. “I” represents error bars for the various determinations (n = 3).

