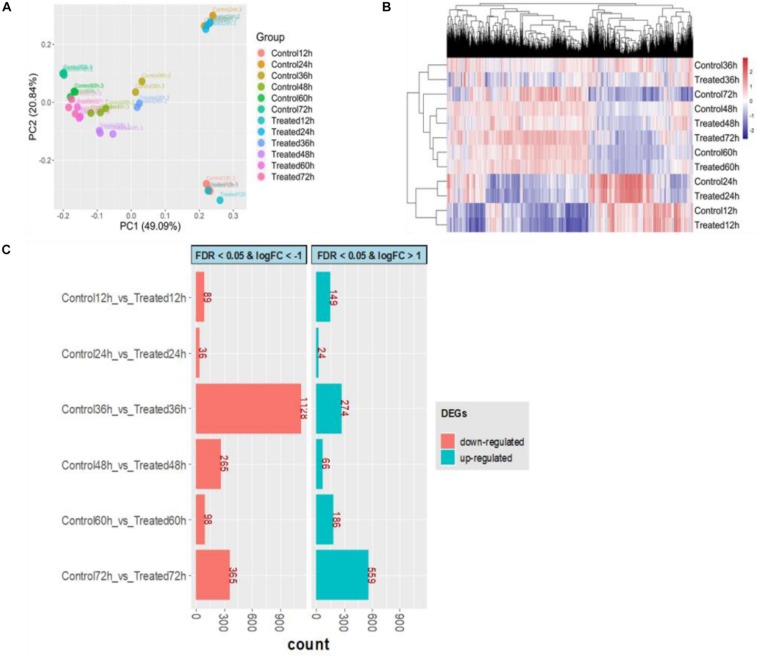
FIGURE 6.
Overview of transcriptional analysis between control and treatment. (A) Principal component analysis for all samples. (B) Hierarchical clustering for transcriptome profile. (C) The number of differentially expressed genes (DEGs); red represents downregulated, and green represents upregulated. The control groups (Control12h, Control24h, Control36h, Control48h, Control60h, Control72h) represent that S. limacinum SR21 was cultured in basal fermentation medium with 1.0 g/L yeast extract at 12, 24, 36, 48, 60, and 72 h, respectively. The treated groups (Treated12h, Treated24h, Treated36h, Treated48h, Treated60h, Treated72h) represent that S. limacinum SR21 was cultured in basal fermentation medium with 0.5 g/L yeast extract at 12, 24, 36, 48, 60, and 72 h, respectively.

