FIGURE 7.
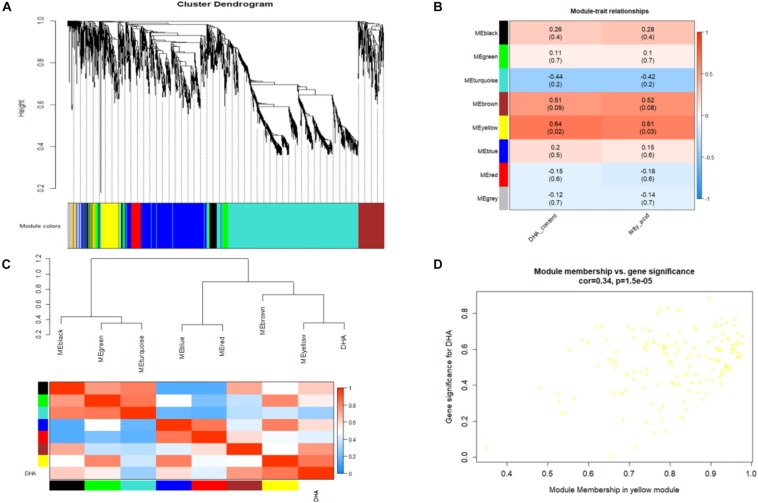
(A) Cluster dendrogram and module assignment from WGCNA. Each color represents a certain gene module. (B) Heatmap of the correlation of WGCNA modules with traits. Red is the correlation between module and trait, and blue is a negative correlation. The module highlighted with dark color represents a significant module associated with traits. (C) The eigengene dendrogram and heatmap for modules with DHA. (D) Correlation between significant genes and module membership in the yellow module.

