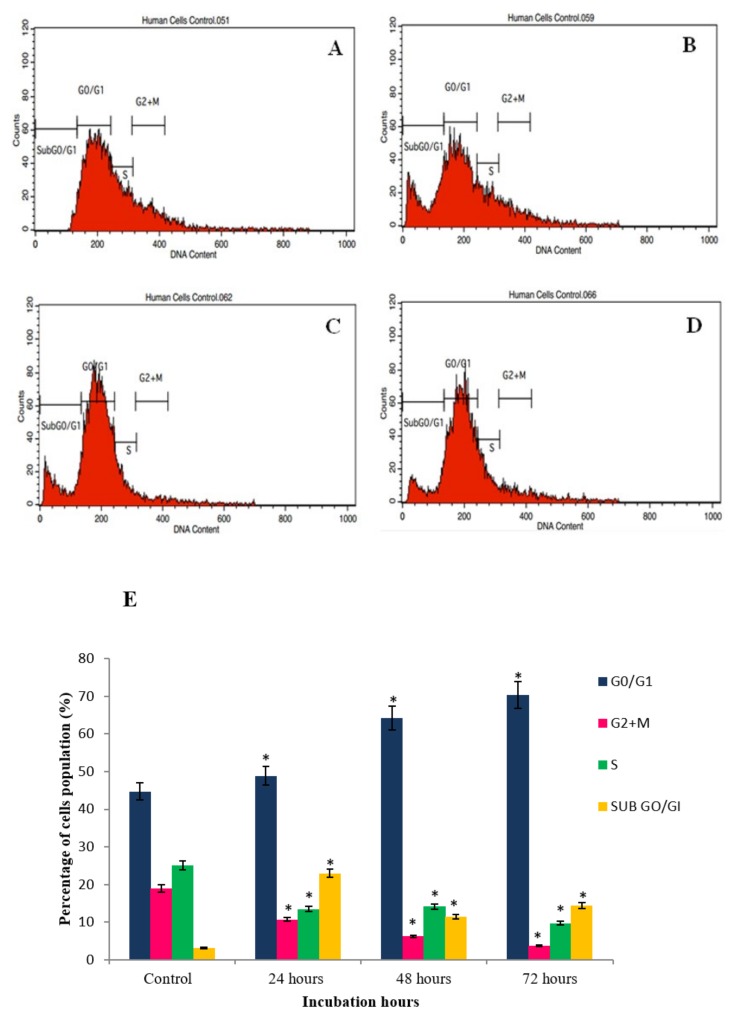
Figure 7.
Cell cycle arrest histogram of GNST-ITC-treated MCF-7 cells at 5.02 µM in a time-dependent manner by flow cytometry: (A–D) control and 24 h, 48 h, and 72 h treated cells respectively. (E) Bar chart shows percentage of cells distribution after the treatment. Values are presented as means ± SD of triplicate experiments. Significant difference (p < 0.05) as compared to control is indicated by asterisk.

