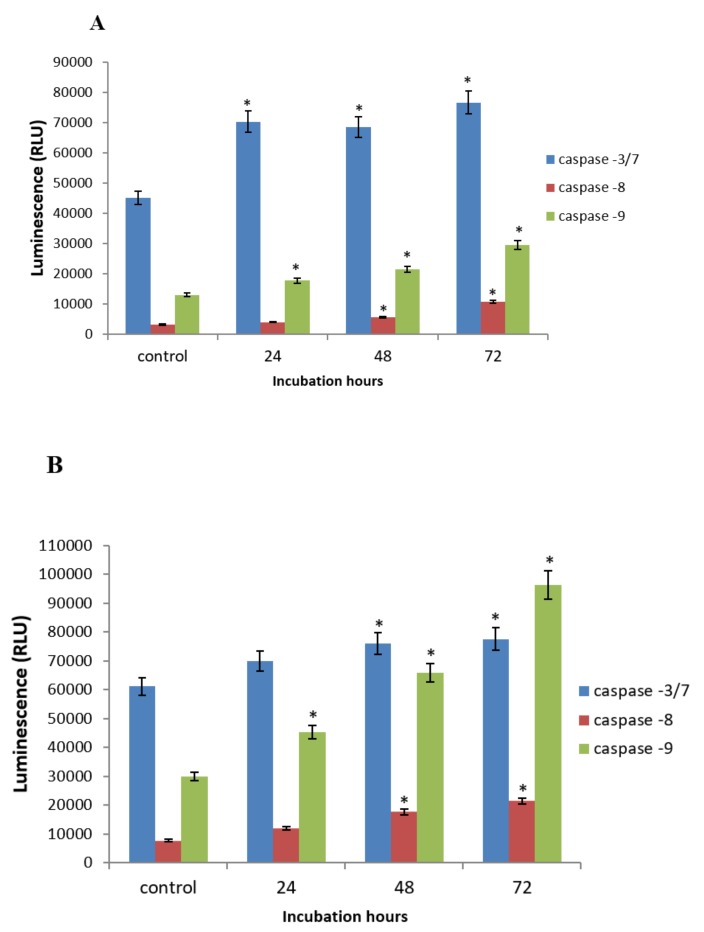
Figure 8.
Modulation of caspase-3/7, -8, and -9 in HepG2 cells (A) and MCF-7 cells (B) treated with GNST-ITC at 7.83 μM and 5.02 μM, respectively for 24, 48, and 72 h measured using luminescence based-assay: Cells were cultured in serum free RPMI-1640 media and maintained at 37 °C and 5% CO2. Values are presented as means ± SD of triplicate experiments. Significant difference (p < 0.05) as compared to control is indicated by asterisk.

