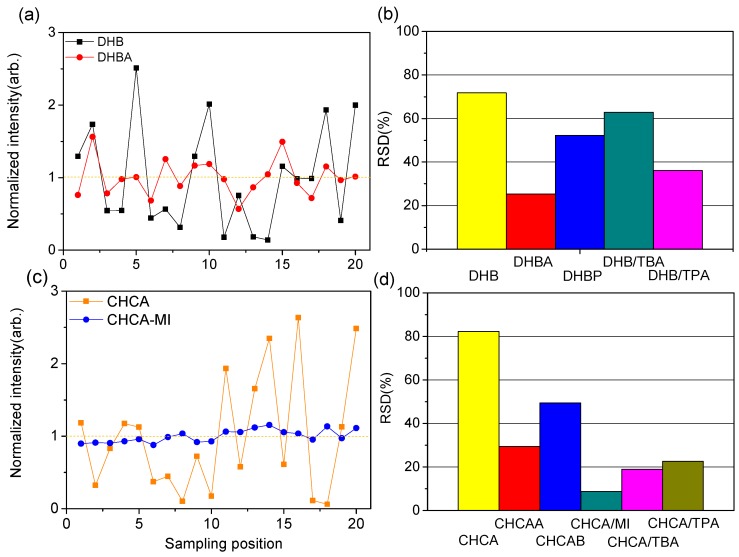
Figure 4.
Plot of normalized [ATP-H]− signal distribution of (a) DHB (black square) and DHBA IL (red circle) and (c) CHCA (orange square) and CHCA/MI IL (blue circle). The averaged RSD value in 20 different positions of (b) DHB ILs and (d) CHCA ILs. Each sampling spot was irradiated by 1000 laser shots.

