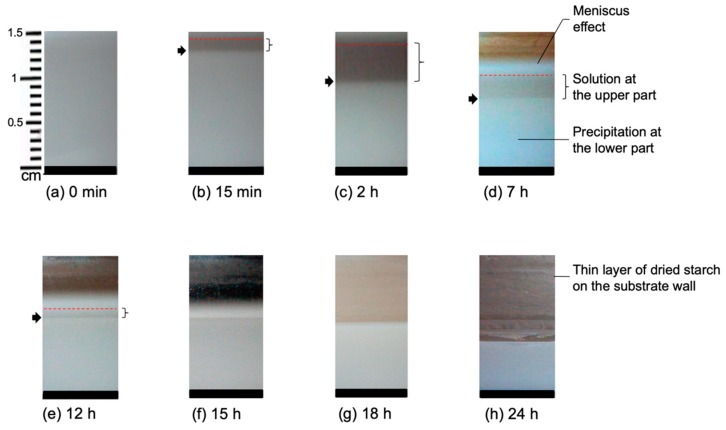
Figure 1.
Sample a containing 1% starch in H2O at different stages of drying. The evolution time increases from (a) 15 min to (h) 24 h. The arrow shows the phase separation, whereas the bracket shows the upper solution layer. The different backgrounds in the upper part of the pictures are due to the different light at different times of the day.

