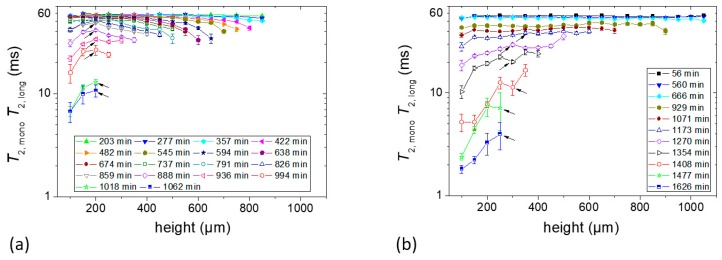
Figure 5.
T2 constants at different heights of the sample. (a) Sample c containing 1% starch in H2O (w/v) and (b) Sample d containing 5% starch in H2O (w/v). Each sample contained glycerol (20 g/100 g of starch) as a plasticizer. Layer positions correspond to coordinates introduced in Figure 3. At the later stage of drying, the echo decays were fitted with two exponential decay functions from the bottom of the sample to a certain height which is shown by the arrows. In the case of bi-exponential decay, the effective T2 data shown in both figures correspond to the slowly decaying components.

