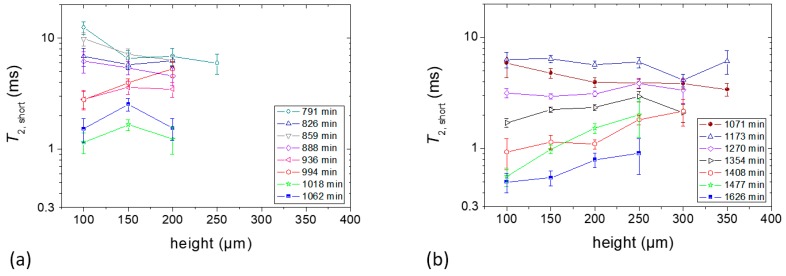
Figure 6.
T2 values of the fast decaying components at different heights of the sample. (a) Sample c containing 1% starch in H2O (w/v) and (b) Sample d containing 5% starch in H2O (w/v). Each sample contained glycerol (20 g/100 g of starch) as a plasticizer. Layer positions correspond to coordinates introduced in Figure 3.

