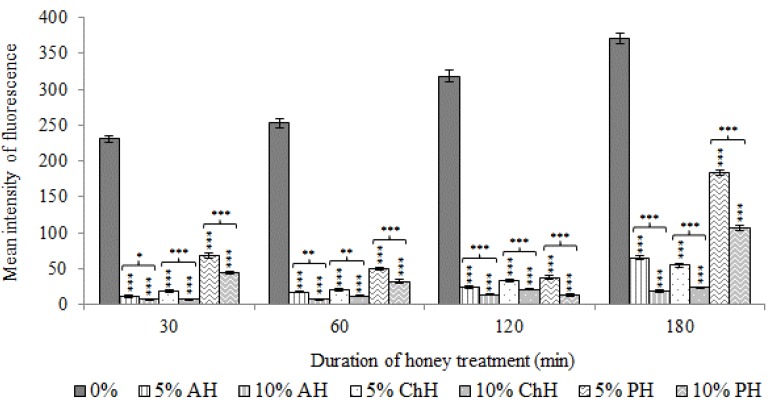
Figure 4.
Effects of avocado honey (AH), chestnut honey (ChH) and polyfloral honey (PH) on S. aureus CECT 86 metabolic activity, evaluated using calcein-AM staining. Data at each time point corresponds to mean values of mean intensity of fluorescence (MIF)± standard deviation. NS indicate no significant differences and asterisks indicate significant differences (*: p < 0.05; **: p < 0.01; ***: p < 0.001) between treated cells vs. the control (non-treated cells) and between the two honey concentrations tested for each honey variety.

