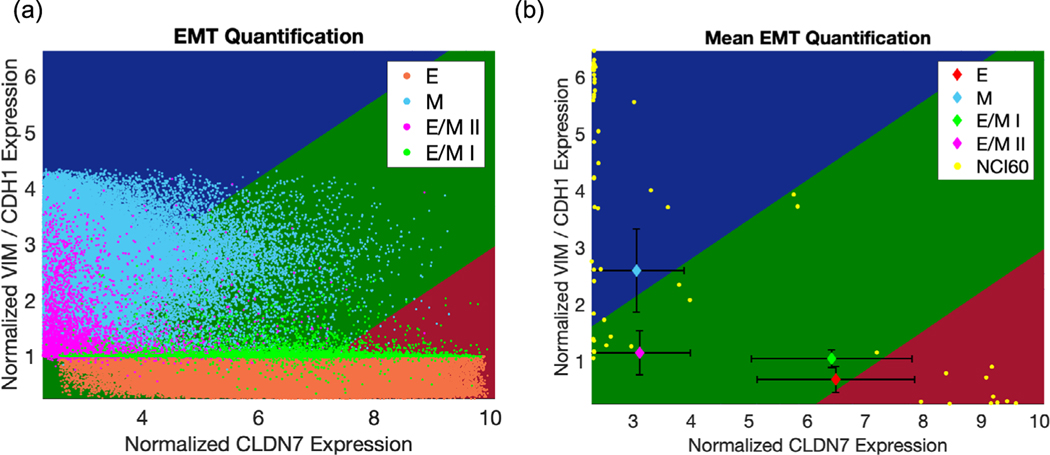
Figure 2.
Characterization of the RACIPE-generated samples by the EMT metric. (a) Population level projection of RACIPE generated data onto EMT metric predictor space. VIM, CDH1, and CLDN7 expression values for each sample generated from RACIPE are used to plot various populations categorized by RACIPE (red region of EMT metric predictor space corresponding to E, dark green corresponding to hybrid E/M I and hybrid E/M II, and blue corresponding to M; salmon identifying RACIPE-generated E samples, light green identifying hybrid E/M I samples, magenta identifying hybrid E/M II samples and sky blue identifying M samples). (b) Predicted mean expression signature for each RACIPE population cluster. Each colored diamond represents the mean expression of RACIPE-predicted hybrid E/M I (light green), hybrid E/M II (magenta), E (salmon), and M (sky blue) samples, plotted longside the NCI-60 training dataset (yellow). Black error bars represent standard deviations along each predictor dimension.

