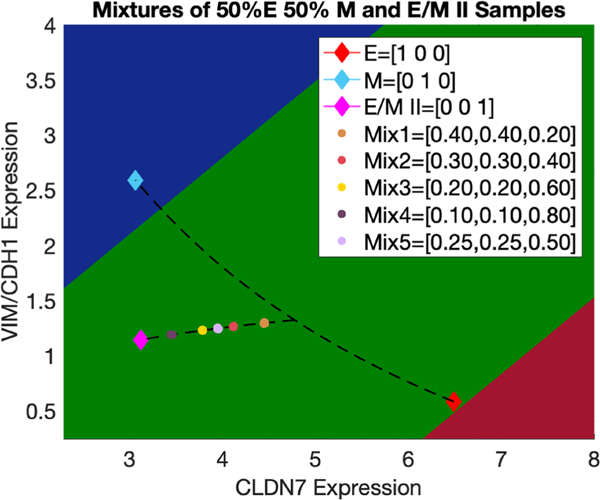
Figure 3.
Use of the EMT metric to characterize the mixtures of E, M and hybrid E/M samples where the proportion of E is equal to that of M in each mixture. Predicted mixture proportions contained in each mixture {E, M, E/M II} are reported in the figure legends for each sample and predicted based on their projection to the convex mixture curve adjoining E/M II and the midpoint of E and M.

