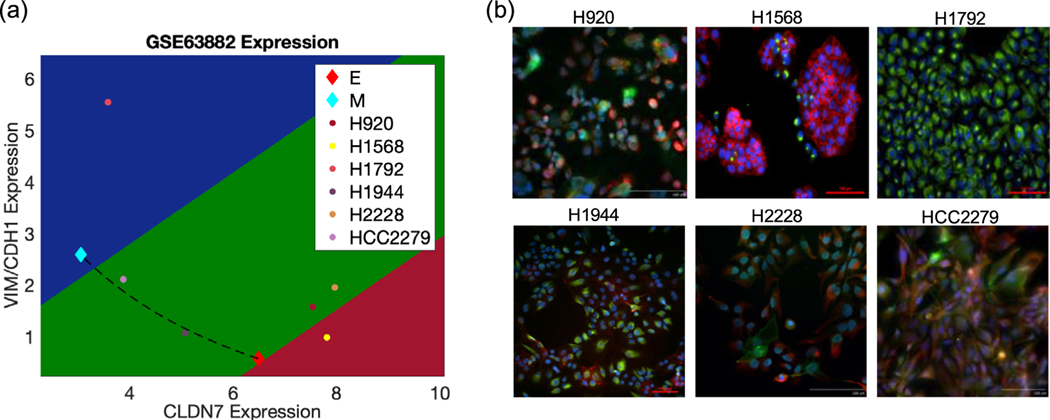
Figure 5.
Characterizing the EMT phenotypes. (a) EMT expression signatures for H920, H1568, H1792, H1944, H2228, and HCC2279 are projected into EMT predictor space relative to the mixture curve between RACIPE-generated E and M samples. (b) Expression of E-cadherin (red) and vimentin (green) examined by immunofluorescence staining. Scale bar 100 μm.

