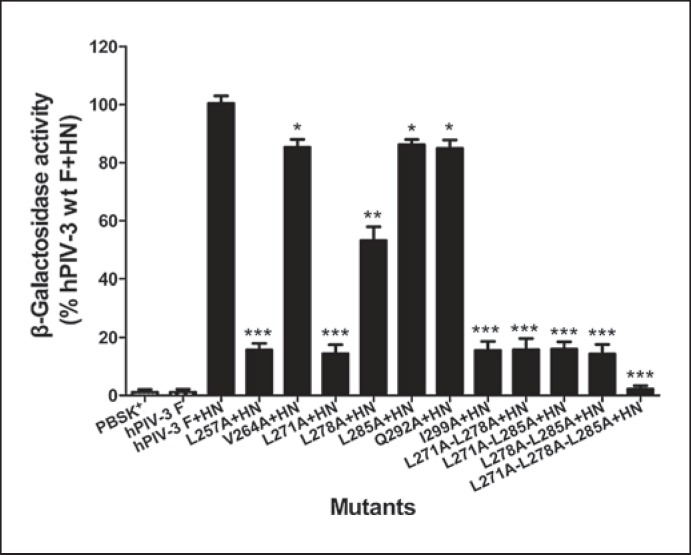
Fig. 3.
Content mixing of wt and mutated F proteins. Quantification of the extent of content mixing directed by wt or mutated F proteins with their homologous HN proteins as measured by β-galactosidase activity. Values are expressed as percentages of the fusion activity detected in cells coexpressing HN and wt F proteins. Results are expressed as means ± SD of 3 independent experiments. * p < 0.05, ** p < 0.01, *** p < 0.001.

