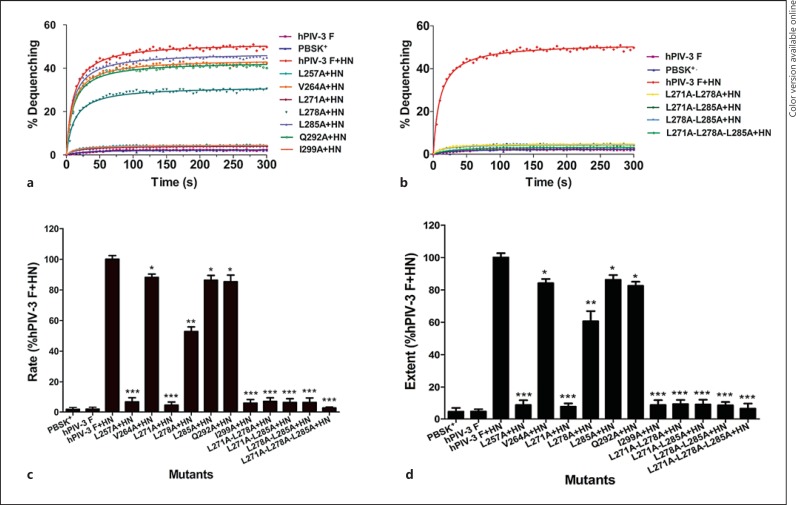
Fig. 5.
Kinetics of hemifusion induced by hPIV-3 wt or mutated F and HN glycoproteins. BHK-21 cells coexpressing wt or mutated F and HN proteins were incubated with R18-labeled RBC to form the RBC-cell complexes, and the fluorescence measurements were performed as described in Materials and Methods. a, b Kinetics of fluorescence dequenching of the RBC-cell complexes. All data points represent the average of at least 3 independent experiments. Nonlinear regression on data points was performed with GraphPad Prism 5.0. c Quantification of the rates of hemifusion. The rates of fluorescence dequenching were calculated from the maximum slopes of fit curves as shown in a and b, and they were normalized to the maximum rate of hemifusion induced by the wt F and HN proteins. The results shown are the means ± SD. * p < 0.05, ** p < 0.01, *** p < 0.001 of 3 independent experiments. d Measurement of the extent of R18 dequenching kinetics. The maximum extent of fluorescence dequenching at 5 min was calculated from kinetics curves analogous to those shown in figure a and b. Data are expressed as the percent activity with respect to the level of the wt F and HN proteins and are shown as means ± SD of 3 separate experiments. * p < 0.05, ** p < 0.01, *** p < 0.001.

