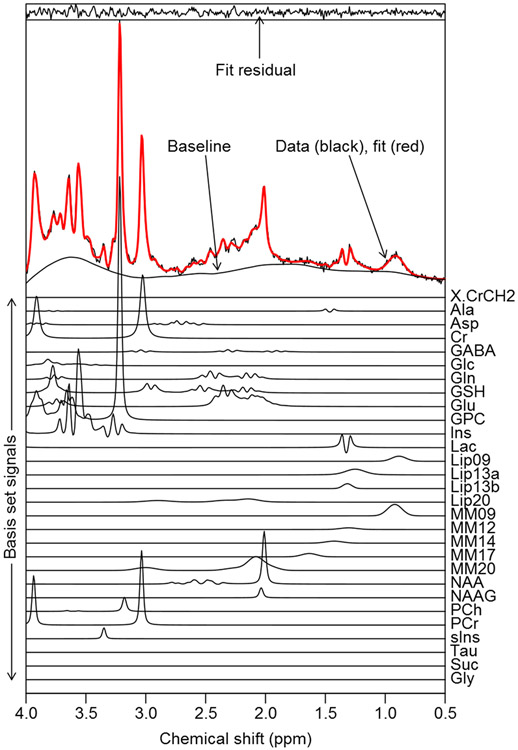
Figure 1.
An adult low grade-glioma brain tumor spectrum acquired at 3 T with PRESS SVS localization, 18mm sided cubic voxel, 128 averages, TE=32 ms and TR=2 s. Parametric fitting was performed with the TARQUIN algorithm (35) using a simulated basis-set of metabolite, lipid and macromolecule signals. Although a greater level of spectral detail is available when compared to 1.5 T, particularly for strongly J-coupled metabolites such as Glu and mI, data quality is highly dependent on achieving good shimming. For this example, a metabolite FWHM of 0.03 ppm and SNR of 83 were achieved, where the FWHM was measured from the highest metabolite signal (tCho=GPC+PCh) following baseline subtraction. SNR was calculated as the ratio between the highest, baseline subtracted, metabolite signal intensity and two times the standard deviation of the noise level estimated from a spectral region free from metabolite signals.

