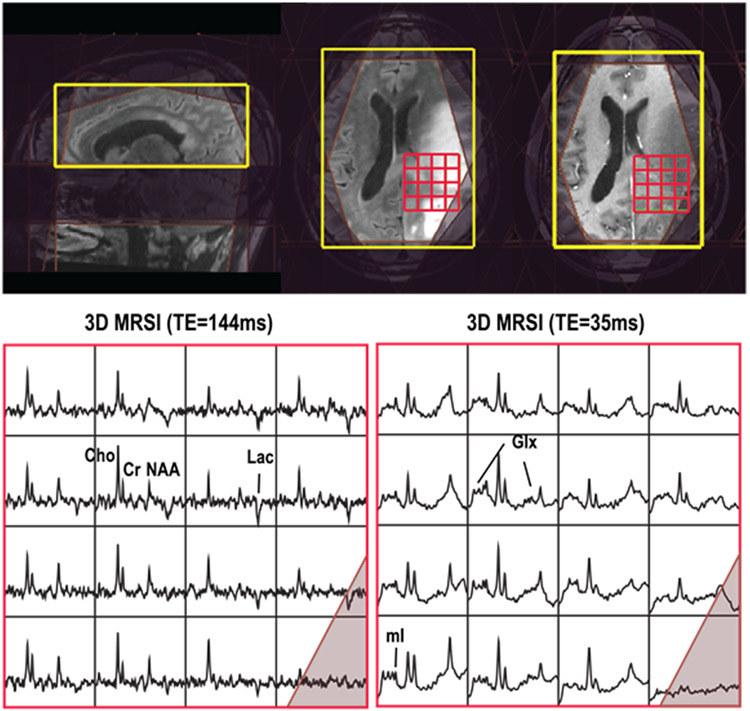
Figure 3.
3D MRSI (bottom left: TE=144 ms, TR=1.25 s; bottom right: TE=35 ms, TR=1.3 s) acquired at 3T from a patient with glioblastoma. Both scans had a nominal voxel resolution of 1 cm3, and 4 Hz spectral apodization was applied. The PRESS excitation volume (yellow rectangle) and 8 VSS outer suppression bands (shaded purple) are shown in the top panel. Both the PRESS volume and VSS outer suppression bands were automatically prescribed using in-house software (107). Good-quality spectra from the red gridded region (top) of slices close to the center of the PRESS box are highlighted for both long and short echo times (bottom).

