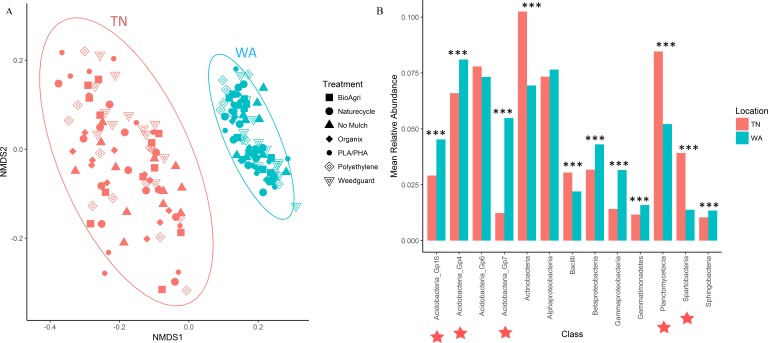
Figure 1. Bacterial community composition differences between the two field locations, showing communities from all four sampling times.
(A) Non-metric multidimensional scaling (NMDS) ordination of Bray-Curtis dissimilarities of OTU relative abundances, highlighting differences between location (PERMANOVA p = 0.001). Each point corresponds to the microbial community of one plot in the field (4 sampling times * 3 replicate plots, resulting in 12 points for each treatment). Ellipses denote clustering at 95% confidence. NMDS stress value: 0.14. (B) Bar plot showing differences in mean relative abundance of the most abundant classes of bacteria in TN and WA, aggregating all treatments and all four sampling times. Asterices denote significant differences between locations, determined by ANOVA (*p ≤ 0.05, **p ≤ 0.01, ***p ≤ 0.001). Red stars indicate taxa which cumulatively contributed up to 46% of the variance in microbial communities between TN and WA, determined using SIMPER.

