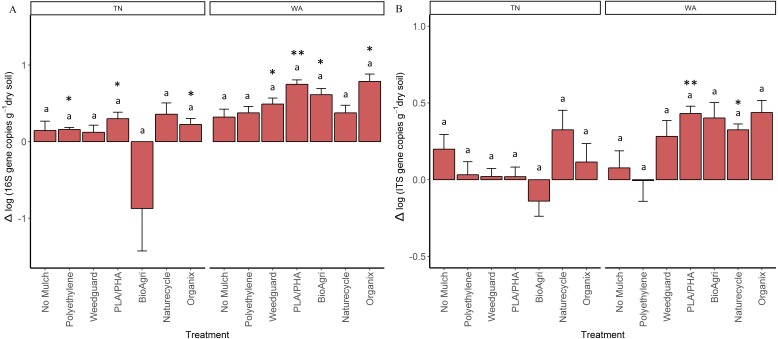
Figure 4. Change in bacterial and fungal abundances over the duration of the two-year experiment in TN and WA.
Net change in (A) bacterial 16S rRNA and (B) fungal ITS gene copy abundances per gram dry weight soil. Net changes were calculated by subtracting starting abundances (Spring 2015) from final abundances (Fall 2016). Error bars are SE of four replicate samples. Lowercase letters denote significant groupings between treatments (p ≤ 0.05, Tukey’s HSD). Asterices indicate treatments which showed significant enrichment (i.e., significant difference from 0) using a paired t-test (*p ≤ 0.05, **p ≤ 0.01, ***p ≤ 0.001).

