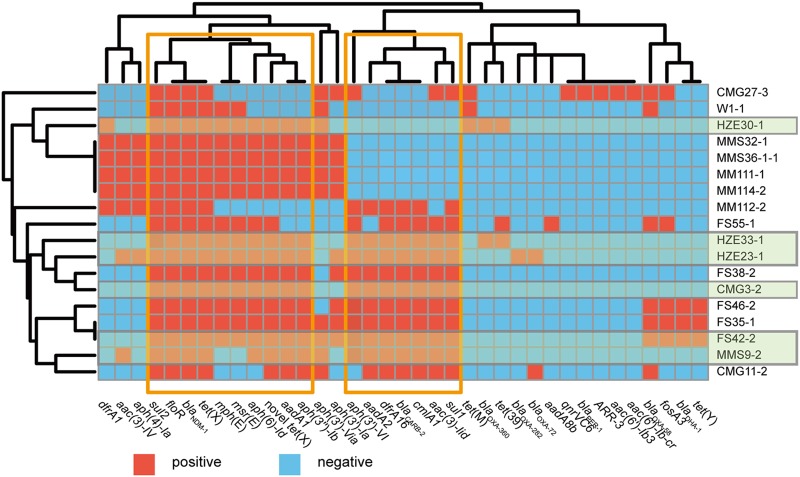
FIG 3.
A heat map of the antimicrobial resistance genes for 18 Acinetobacter species isolates cocarrying tet(X) and blaNDM-1. Genes positive and negative for resistance are indicated. Green shading indicates the strains in which tet(X) and blaNDM-1 are located on the same plasmids. Areas boxed in orange indicate the two major resistance gene clusters. The heat map was generated using R, version 3.3.2 (R Foundation for Statistical Computing) using the pheatmap package (https://cran.r-project.org/web/packages/pheatmap/).

