
FIG 2.
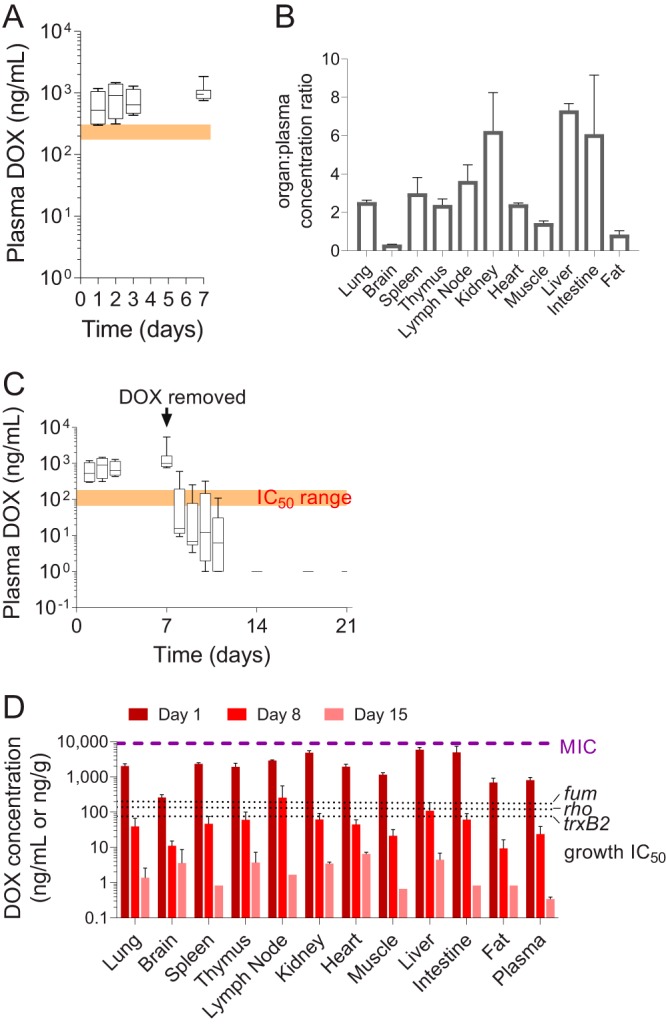
Plasma and tissue pharmacokinetics of DOX in mice receiving DOX-supplemented diet. (A) Box and whisker plot of DOX plasma concentrations in mice receiving 2,000 ppm DOX in standard diet for 7 days. Mean values (bar), minimum and maximum (box) and standard deviations (error bars) are shown for n = 4 to 11 mice per group. The orange shaded window indicates the range of in vitro DOX concentration that inhibits 90% of bacterial growth (IC90) for the three reporter strains shown in Fig. 1. (B) DOX concentrations in mouse organs relative to plasma after 7 days on the DOX diet. Mean values and standard deviations (error bars) are shown (n = 3). (C) Kinetics of DOX clearance in plasma following removal of DOX from the diet for 14 days. Mean values (bar) and minimum and maximum (box) and standard deviations (error bars) are shown (n = 3 to 12). The orange shaded window indicates the range of in vitro DOX concentrations that inhibit 50% of bacterial growth (IC50) for the three reporter strains shown in Fig. 1. (D) Kinetics of DOX clearance from major organs of TB-infected mice 7 and 14 days after removal of DOX from the diet. Day 1 corresponds to DOX levels in mice that had received a DOX-supplemented diet for 1 week, after which it was replaced by a DOX-free diet for the duration of the experiment. The purple dotted line indicates the lower boundary of published MIC ranges against wild-type M. tuberculosis (11), and the black dotted lines show individual DOX IC50s for the three reporter strains (Fig. 1). Mean values and standard deviations (error bars) are shown (n = 3).