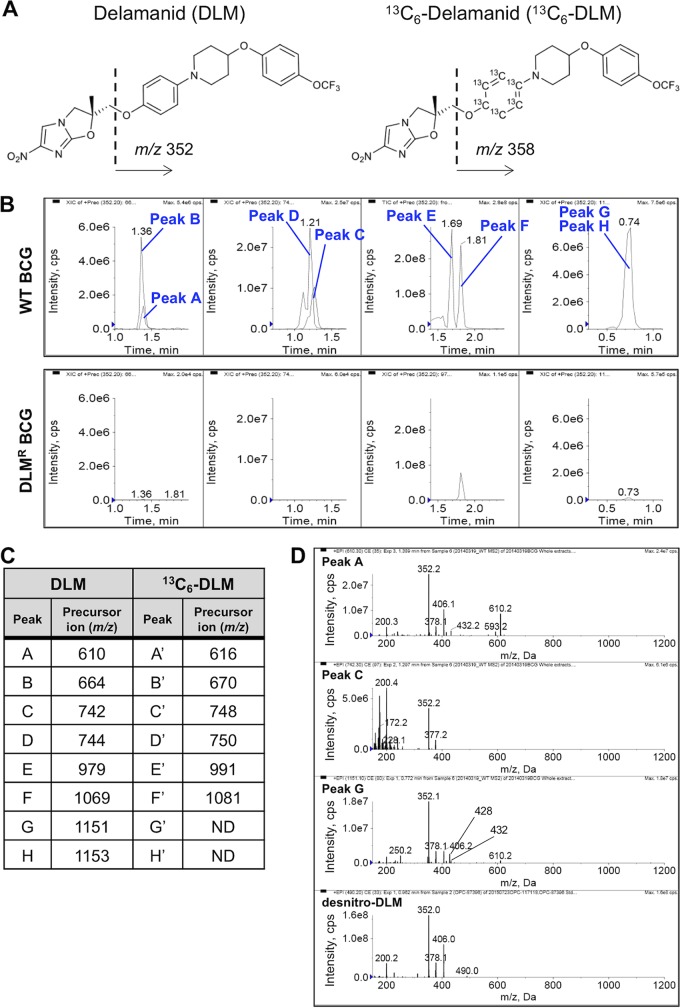
FIG 2.
Identification of DLM-binding molecules, comparing the WT and DLMr BCG strains using a precursor ion scan. (A) Chemical structures of DLM and 13C6-DLM. When DLM or 13C6-DLM was analyzed with a product ion scan, a fragment ion of m/z 352 or 358 was identified as the characteristic major fragment ion. (B) LC peak profiles obtained using LC-MS analysis of DLM-binding molecules using a precursor ion scan. Cellular components extracted from WT and DLMr BCG strains were analyzed with LC-MS analysis using a precursor ion scan for m/z 352. Each panel indicates the extracted ion chromatograms of components identified by the precursor ion scan for m/z 352 in the ranges of m/z 500 to 700 (left), m/z 700 to 800 (second from left), m/z 900 to 1,100 (second from right), and m/z 1,100 to 1,200 (right). Upper panels, components extracted from WT BCG; lower panels, components extracted from DLMr BCG. (C) Summary of precursor ions specifically detected in the extracts of DLM- or 13C6-DLM-treated WT BCG using a precursor ion scan for m/z 352 and 358, respectively. Original precursor ion spectra of the extracts are shown in Fig. S1. ND, not detected because the intensity was weak. (D) Product ion spectra of peaks A, C, G, and desnitro-DLM. Common fragment ions with m/z 378 (or 377), 352, and 200 are detected in each spectrum.

