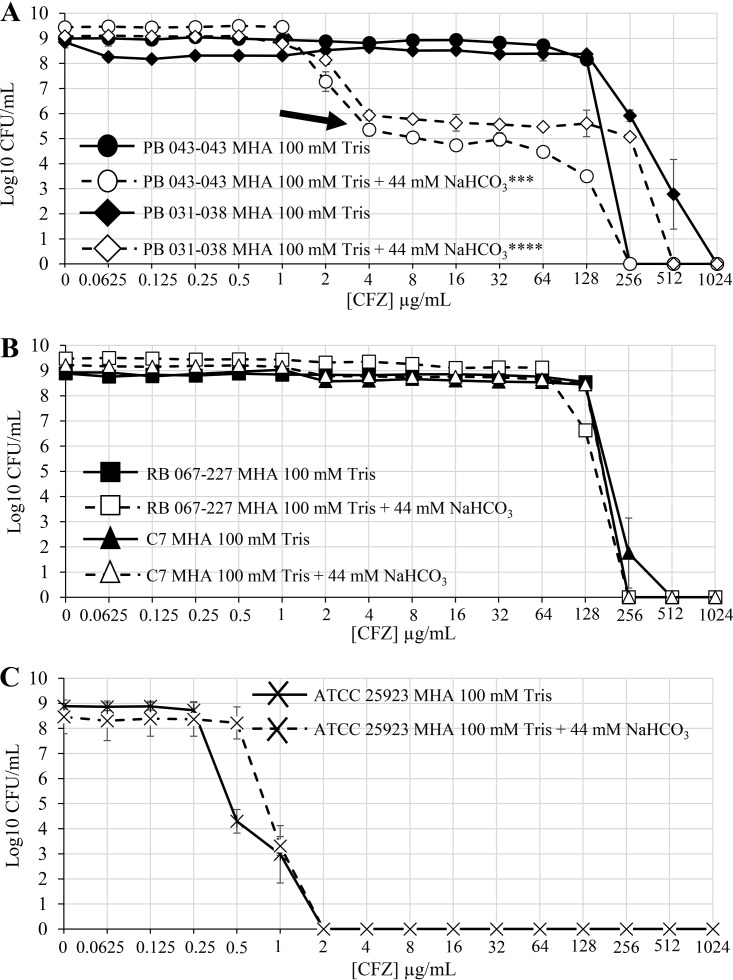
FIG 2.
Population analysis profiles for NaHCO3-responsive and nonresponsive strains. (A) Population analysis profiles of CFZ for NaHCO3-responsive strains in the presence and absence of NaHCO3. The area under the curve (AUC), calculated by linear approximation, was significantly decreased by exposure to NaHCO3 in both strains as analyzed by Student’s t test (PB 043-043, ***, P < 0.001; PB 031-038, ****, P < 0.0001). (B) Population analysis profiles of CFZ for NaHCO3-nonresponsive strains in the presence and absence of NaHCO3. As analyzed by Student’s t test, there is no significant difference in the AUC for C7 in media ± NaHCO3; the AUC of RB 067-227 was significantly increased by exposure to NaHCO3 (*, P < 0.05). (C) Population analysis profiles of CFZ for the methicillin-susceptible S. aureus (MSSA) strain ATCC 25923.

