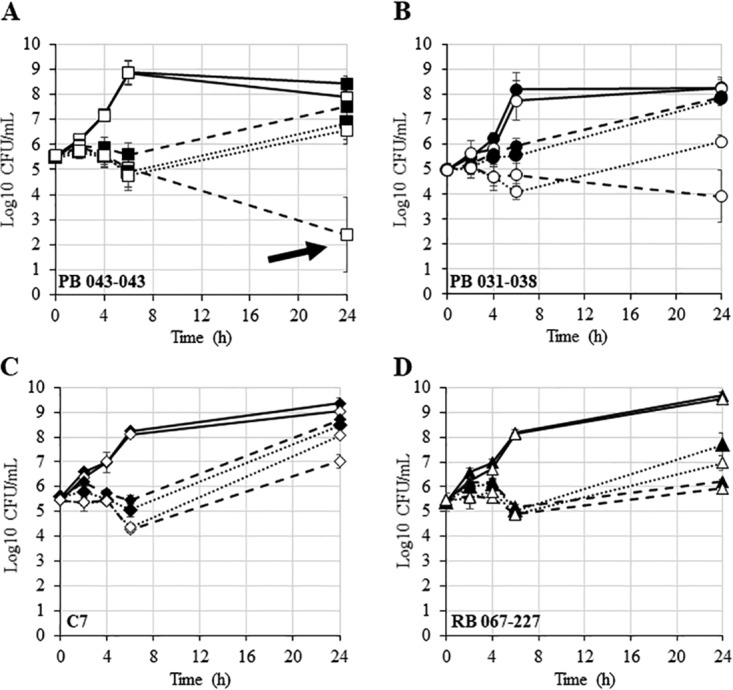
FIG 3.

Time kill curves for NaHCO3-responsive and nonresponsive strains. (A) PB 043-043 (squares). (B) PB 031-038 (circles). (C) C7 (diamonds). (D) RB 067-227 (triangles). Closed symbols represent growth in CA-MHB 100 mM Tris, open symbols represent growth in CA-MHB 100 mM Tris + 44 mM NaHCO3, solid lines represent no drug control, dashed lines represent exposure to CFZ, and dotted lines represents exposure to OXA. Drug concentrations for PB 043-043 were 16 μg/ml for CFZ and 32 μg/ml for OXA; drug concentrations for all other strains were 64 μg/ml for both CFZ and OXA.
