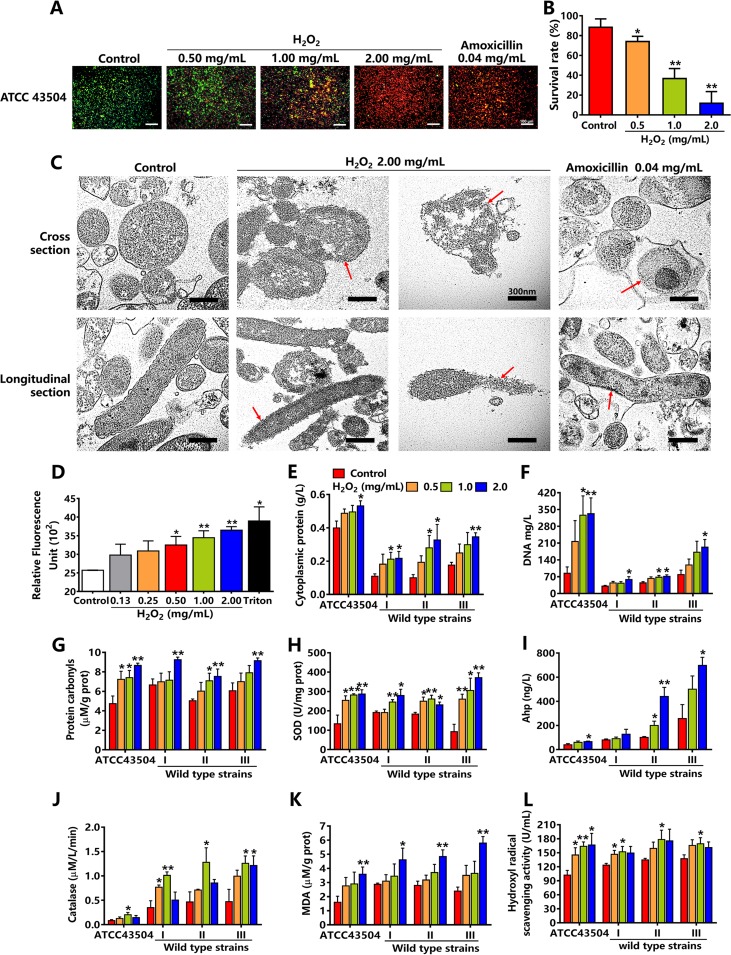
FIG 5.
The effect of hydrogen peroxide (H2O2) on bacterial cell membranes and enzymes of H. pylori. (A) SYTO 9/PI stain of H. pylori ATCC 43504 incubated with hydrogen peroxide at 0.5, 1, and 2 mg/ml. Amoxicillin was the positive control. Green fluorescence indicates living H. pylori ATCC 43504; red fluorescence indicates dead H. pylori ATCC 43504. (B) Survival rates of H. pylori ATCC 43504 incubated with hydrogen peroxide at 0.5, 1, and 2 mg/ml by flow cytometry (n = 6). (C) The morphology of H. pylori ATCC 43504 incubated with hydrogen peroxide at 2 mg/ml by transmission electron microscopy. Amoxicillin was the positive control, which damaged bacterial cell walls, not cell membranes (n = 3). Red arrows showed bacterial cell membranes. The bar length measurement was 300 nm. (D) The disruption of bacterial cell membranes in H. pylori ATCC 43504 incubated with hydrogen peroxide at 2 mg/ml by 1-N-phenyl-naphtylamine (blue fluorescence). Triton X-100 was the positive control (n = 4). (E and F) Leakage of cytoplasmic proteins and DNA in four H. pylori strains incubated with hydrogen peroxide at 0.5, 1, and 2 mg/ml (n = 6). (G to J) The protein carbonyls and activities of three enzymes: superoxide dismutase (SOD), alkyl hydroperoxide reductase (Ahp), and catalase of four H. pylori strains incubated with hydrogen peroxide at 0.5, 1, and 2 mg/ml (n = 6). (K and L) Malondialdehyde (MDA) and hydroxyl radical scavenging activities of four H. pylori strains incubated with hydrogen peroxide at 0.5, 1, and 2 mg/ml (n = 6). Values given are mean ± SE; *, P < 0.05; and **, P < 0.01 versus control, as determined by one-way ANOVA and Student’s t test.

