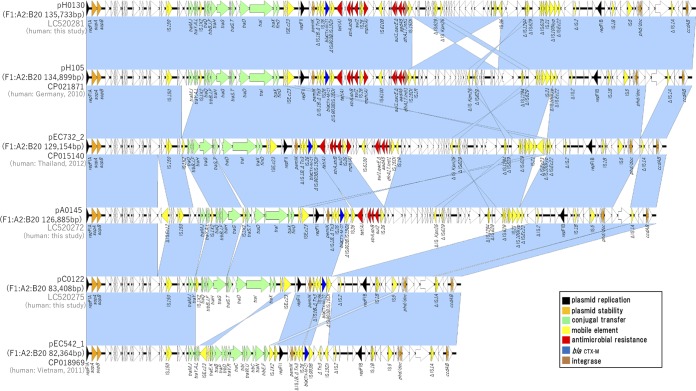
FIG 3.
Genetic comparison of representative plasmids from LTCF residents. The complete sequences of pH00130, pA0145, pC0122, pH105, pEC732_2, and pEC542_1 were compared using Easyfig 2.2.2 and BLASTn. The open reading frames are represented by arrows and color coded according to their functions. Nucleotide sequence identities between the plasmid sequences are indicated by color shading, and gene functions are indicated on the right. blaCTX-M-27 is blue, insertion sequences are yellow, and antimicrobial resistance genes are red.

