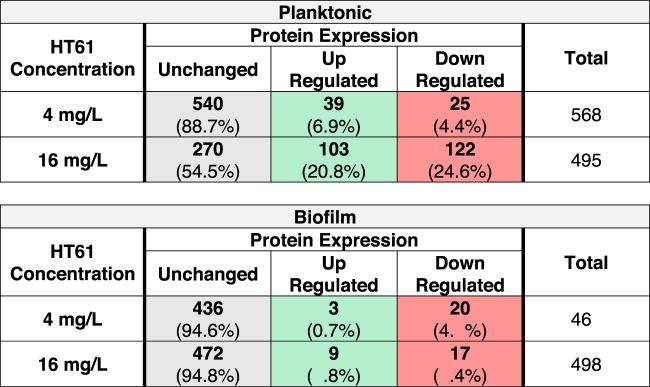
TABLE 1.
Summary of differential protein expression between untreated, sub-MIC-treated, and MIC-treated S. aureus planktonic and biofilm culturesa
Inclusion criteria for quantitative analysis and comparison were set at 3 peptide matches, false-discovery rate (FDR) of ≤1%, and sequence coverage of ≥5%, with P values of ≤0.05. Data highlighted in gray, green, and red represent numbers (percentages) of samples with unchanged, upregulated, and downregulated expression, respectively. MIC, 16 mg/liter; sub-MIC, 4 mg/liter.

