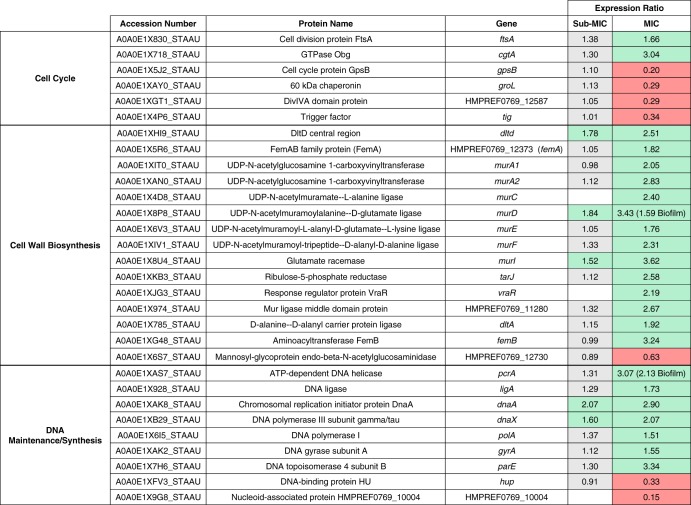
TABLE 2.
Differentially expressed proteins associated with the dcw and cell wall stress stimulon in S. aureus following treatment of planktonic cultures with HT61a
Expression ratios reflect changes in expression between untreated cultures and those treated with either sub-MIC (4 mg/liter) or MIC (16 mg/liter) levels of HT61. Differential expression in biofilms is indicated in parentheses. Differential expression is defined as a fold change of ≥1.5 for upregulation (green cells) and ≤ 0.667 for downregulation (red cells). Gray cells indicate no change in expression. Empty cells represent proteins not identified.

