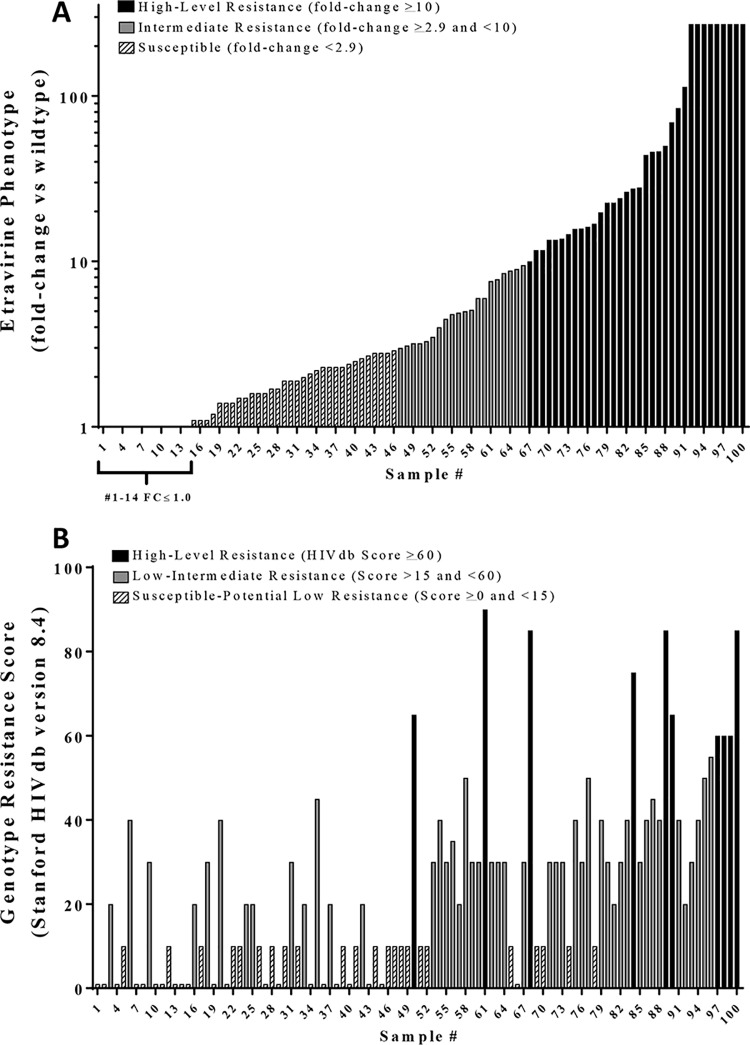
FIG 1.
ETR resistance of 100 first-line antiretroviral treatment failures. (A) ETR fold change (FC) values were determined by dividing the EC50 generated for each plasma-derived virus by a composite EC50 from 12 treatment-naive plasma-derived viruses collected form the same geographical region. The bar color and pattern indicate the ETR phenotypic clinical cutoffs of <2.9 FC as susceptible (diagonal stripes), ≥2.9 FC (gray) as intermediate resistance, and >10 FC as high-level resistance (black). The EC50 values of samples 91 through 100 exceeded the highest concentration of ETR that could be tested in TZM-bl cells without cytotoxicity and are reported as >272 nM. (B) The GRT-IS scores were determined using the HIVdb resistance interpretation algorithm version 8.4 (13). The five HIVdb classifications were collapsed into three by merging susceptible and/potential low-level into “susceptible” and low-level and/intermediate into a “low-intermediate” for comparison.

